
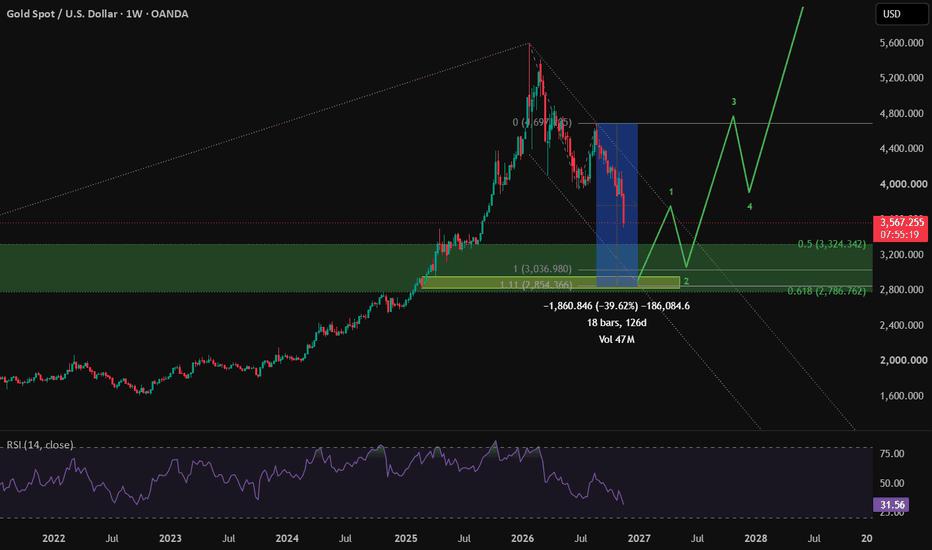
XAU/USD is undergoing a sharp corrective pullback toward a major Fibonacci demand zone between $2,786 and $3,324 before an anticipated multi-wave bullish continuation.
Chart Breakdown & Price Action
• Current Weekly Candle: Gold is trading around $3,571.05, down roughly 8.07% (-$313.63) for the week (opening at $3,885.63, high of $3,901.37, low of $3,514.56). This marks a significant correction from the peak near $4,697.
• Momentum (RSI 14): The weekly Relative Strength Index sits at 31.63, approaching the oversold threshold (30). This indicates strong short-term bearish momentum, though selling pressure is nearing exhaustion levels where historical buyers have stepped in.
Key Technical Levels
• Major Demand / Support Zone (Green Box): ~$2,786 – $3,324
• 0.5 Fibonacci Retracement: $3,324.34 (upper boundary of the target zone).
• 1.0 Fib / Structural Support: $3,036.98.
• 1.11 Extension / 0.618 Macro Fib: $2,854.37 – $2,786.76 (lower boundary of the demand zone). The chart's measurement tool highlights a potential total drawdown of roughly -39.62% (-$1,860) from the highs into this base.
• Overhead Resistance: Immediate psychological and structural resistance sits near $3,818 – $3,900 (current week's high), followed by the prior peak around $4,697.
Tuyên bố miễn trừ trách nhiệm: Quan điểm được trình bày hoàn toàn là của tác giả và không đại diện cho quan điểm chính thức của Followme. Followme không chịu trách nhiệm về tính chính xác, đầy đủ hoặc độ tin cậy của thông tin được cung cấp và không chịu trách nhiệm cho bất kỳ hành động nào được thực hiện dựa trên nội dung, trừ khi được nêu rõ bằng văn bản.
 Chưa có bình luận nào. Hãy là người đầu tiên chia sẻ ý kiến của bạn.