


═══════════════════════════════════════════════════════════════════════════════
THE UNTOLD TRUTH ABOUT ICHIMOKU: BEYOND THE CLOUD
═══════════════════════════════════════════════════════════════════════════════
When most retail traders look at Ichimoku Kinko Hyo, they see only two things:
1. "Buy when price is above the green cloud."
2. "Sell when Tenkan crosses below Kijun."
Treating Ichimoku as a simple lagging moving average cross completely misses the genius of its creator, Goichi Hosoda. Hosoda spent over 30 years with a dedicated research team perfecting a multi-dimensional market forecasting system that unites price, trend, and time.
The complete Ichimoku framework is built on Four Pillars:
1. The 5 Equilibrium Lines (Kinko Hyo): Tenkan, Kijun, Senkou Span A, Senkou Span B, and Chikou Span.
2. Hosoda Wave Theory: The structural rhythm of market swings (I, V, N, P, Y, W waves).
3. Hosoda Price Theory: Quantitative equilibrium projections (V, N, E, NT targets).
4. Hosoda Time Theory & Kasanari: Natural cycle counts (9, 17, 26, 33, 42...) and the rare intersection where Time meets Price.
In this educational breakdown, we analyze how these four dimensions align in real-time on Gold Spot (XAUUSD, 30-Minute) using the "Ichimoku Cloud Pro " engine.
═══════════════════════════════════════════════════════════════════════════════
THE FOUR PILLARS OF HOSODA'S METHODOLOGY DECODED
═══════════════════════════════════════════════════════════════════════════════
1. THE FIVE EQUILIBRIUM LINES & KANZEN ALIGNMENT (◆)
• Tenkan-sen (Conversion Line): 9-period equilibrium midpoint. Measures short-term momentum.
• Kijun-sen (Base Line): 26-period equilibrium midpoint. Acts as dynamic support/resistance and trend baseline.
• Kumo (The Cloud): Formed between Senkou Span A (dynamic momentum) and Senkou Span B (52-period structural midpoint), shifted 26 bars into the future.
• Chikou Span (Lagging Line): Current close plotted 26 bars backwards. Serves as the ultimate momentum filter.
• "Kanzen" (Perfect Alignment ◆): When Price > Tenkan > Kijun > Cloud, and Chikou is in open air with zero candle resistance, the chart achieves "Kanzen." This prints a distinct diamond marker (◆) signaling structural trend dominance.
2. QUANTITATIVE BREAKOUT SCORING (0–100)
Not all cloud breakouts are created equal. Breaking through a paper-thin cloud in a flat chop frequently leads to fakeouts. The engine grades every cloud breakout on an objective 0–100 weighted checklist:
• Cloud Thickness (+30 pts): Was price penetrating a thick, high-energy cloud or an exhausted thin veil?
• Chikou Clearance (+30 pts): Is Chikou free in "open air," or blocked by historical candles?
• Tenkan / Kijun Alignment (+20 pts): Did the cross confirm before or during the breakout?
• Close Margin & Volume (+20 pts): Confirmed close distance beyond Span B on above-average volume.
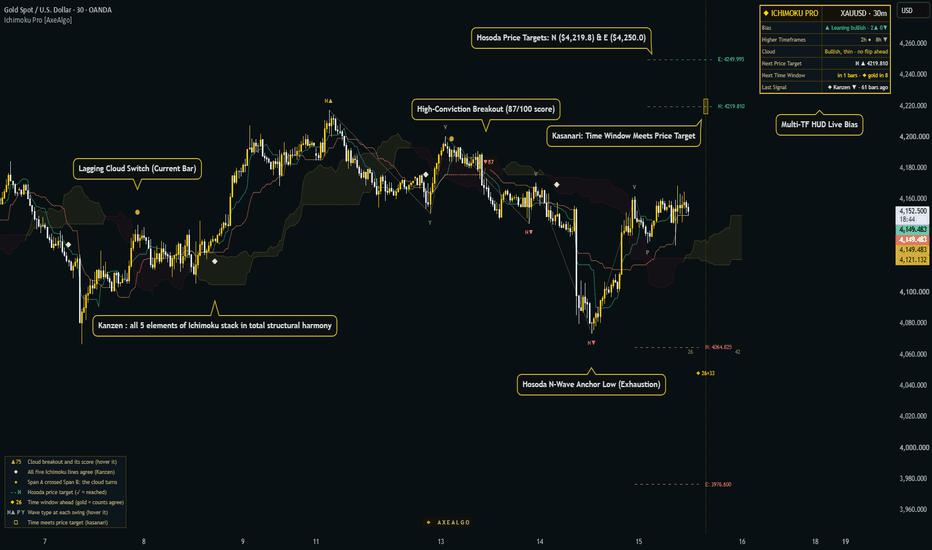
• On our chart, notice the high-conviction breakdown badge labeled that preceded the sharp selloff down to $4,080.

Referencing the snapshot above:
• Bullish Breakout : On the left, price coils under the cloud before surging through Senkou Span B. The engine scored this breakout at 95/100 (near-perfect checklist clearance across thickness, volume, Chikou, and momentum), initiating an explosive +$320 rally from $4,360 straight into $4,680!
• Bearish Breakout : At the top, price re-enters and slices completely through the cloud to the downside, scoring 78/100. This high-conviction breakdown triggered an immediate -$280 cascade from $4,660 down into $4,380.
3. HOSODA WAVE THEORY (STRUCTURAL DNA)
Markets do not move randomly; they construct compound swings out of basic wave archetypes:
• I-Wave: A single impulse leg.
• V-Wave: An impulse and a sharp retracement.
• N-Wave (Primary Trend Continuation): A three-leg sequence (A → B → C). This is the foundation of all trend trading.
• P-Wave: Contracting triangle / volatility squeeze.
• Y-Wave: Expanding megaphone / liquidity expansion.
The indicator automatically tracks confirmed swing pivots and labels these structural wave types directly on the chart.
4. HOSODA PRICE & TIME THEORY (KASANARI ⊓)
Once an N-wave sequence (A → B → C) confirms, Hosoda's mathematical price projections activate:
• V-Target: B + (B − C) → Immediate equilibrium extension.
• N-Target: C + (B − A) → Textbook symmetric projection (measured move).
• E-Target: B + (B − A) → Expanded institutional target.
• Time Cycles (Kihon Sūchi): Hosoda discovered that pivots cluster around master numbers: 9, 17, 26, 33, 42, 65, 76.
• Kasanari (Convergence ⊓): When a gold time cycle aligns with a pending price target, a small gold box prints on the target line. This highlights the specific window where price equilibrium and time rhythm converge!
═══════════════════════════════════════════════════════════════════════════════
LIVE CHART BREAKDOWN: GOLD SPOT (XAUUSD, 30M)
═══════════════════════════════════════════════════════════════════════════════
Looking at the attached chart:
1. The High-Scoring Breakdown (Oct 14):
On Oct 14, Gold violently penetrated Senkou Span B. The engine scored this breakdown at 87/100 (thick cloud penetration + Chikou free in open air + volume expansion), triggering the sharp cascade from $4,190 down into the $4,080 swing low.
2. The V-Reversal & Shift in Equilibrium:
From the $4,080 exhaustion wick, aggressive buying surged back through Kijun-sen, printing a series of higher swing pivots and resetting the wave structure into a fresh bullish N-wave.
3. Active Targets Overhead:
With price reclaiming the baseline and pressing through the thin future cloud:
• Primary Equilibrium: N-Target projected at $4,219.810.
• Extended Expansion: E-Target projected at $4,249.995.
4. The Kasanari Convergence (Time meets Price):
Notice the vertical dashed time line marked "17 ◆ 26+11" and the gold box framed directly at the N-Target ($4,219.810). This marks a high-probability confluence zone where Hosoda's time cycle predicts cycle completion.
5. Top-Right HUD Status:
• Bias: Leaning Bullish (3▲ 0▼ internal alignment)
• Multi-Timeframe Context: 2H Bullish (▲) | 8H Bearish (▼)
• Future Cloud: "Flips ▲ in 2 bars" (anticipating the bullish Kumo twist)
═══════════════════════════════════════════════════════════════════════════════
HOW TO APPLY THIS TO YOUR OWN TRADING
═══════════════════════════════════════════════════════════════════════════════
1. Never trade a cloud breakout blindly. Demand high-scoring clearance (>75) where Chikou is completely unrestricted.
2. Track the N-wave pullback. When swing C confirms, map the N and E targets rather than guessing where momentum will stall.
3. Pay attention to the Kumo twist ahead of price. The cloud 26 bars ahead is not a prediction,it is a visual projection of whether buying or selling power is currently dominant at the median.
Tuyên bố miễn trừ trách nhiệm: Quan điểm được trình bày hoàn toàn là của tác giả và không đại diện cho quan điểm chính thức của Followme. Followme không chịu trách nhiệm về tính chính xác, đầy đủ hoặc độ tin cậy của thông tin được cung cấp và không chịu trách nhiệm cho bất kỳ hành động nào được thực hiện dựa trên nội dung, trừ khi được nêu rõ bằng văn bản.
 Chưa có bình luận nào. Hãy là người đầu tiên chia sẻ ý kiến của bạn.