


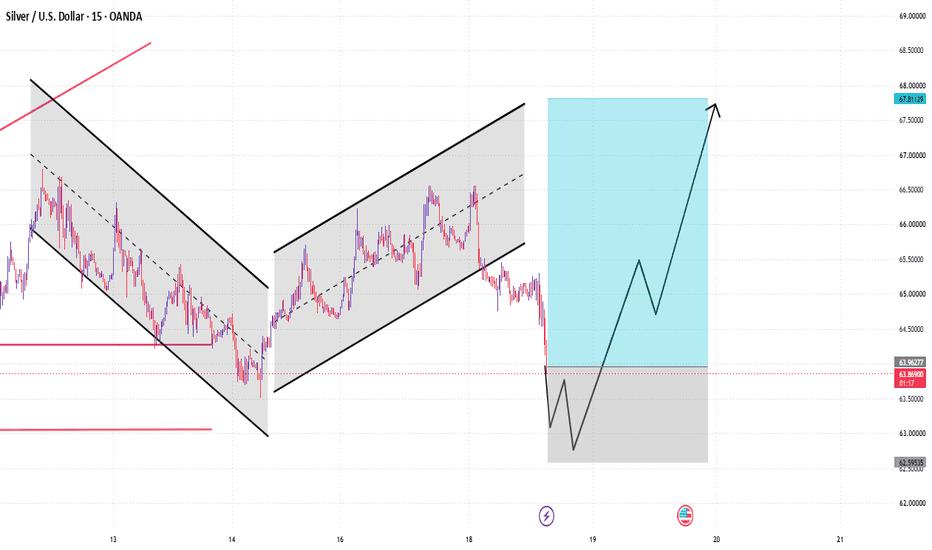
The 15-minute Silver chart shows a transition from a declining channel into a rising channel. Price later reached the upper part of the recovery structure near 66.50, followed by a sharp correction.
Current price is around 63.939, and the recent move has brought price back toward the marked support region.
Important Areas:
63.40 — First support
63.00 — Important lower support
62.80 — Deeper reference area
If price finds stability in this region, the chart projection shows possible recovery levels:
64.50 → 65.50 → 67.00 → 67.50–67.70
Structure to Watch:
Current: 63.94
⬇ 63.40
⬇ 63.00
⬇ 62.80
⬆ 64.50
⬆ 65.50
⬆ 67.00
⬆ 67.50–67.70
A sustained move below the lower support area would weaken the recovery scenario, while a return above 64.50 would indicate improving short-term structure.
Tuyên bố miễn trừ trách nhiệm: Quan điểm được trình bày hoàn toàn là của tác giả và không đại diện cho quan điểm chính thức của Followme. Followme không chịu trách nhiệm về tính chính xác, đầy đủ hoặc độ tin cậy của thông tin được cung cấp và không chịu trách nhiệm cho bất kỳ hành động nào được thực hiện dựa trên nội dung, trừ khi được nêu rõ bằng văn bản.
 Chưa có bình luận nào. Hãy là người đầu tiên chia sẻ ý kiến của bạn.