


1. Trend Overview
Short-term trend: Strongly Bullish
Key signals:
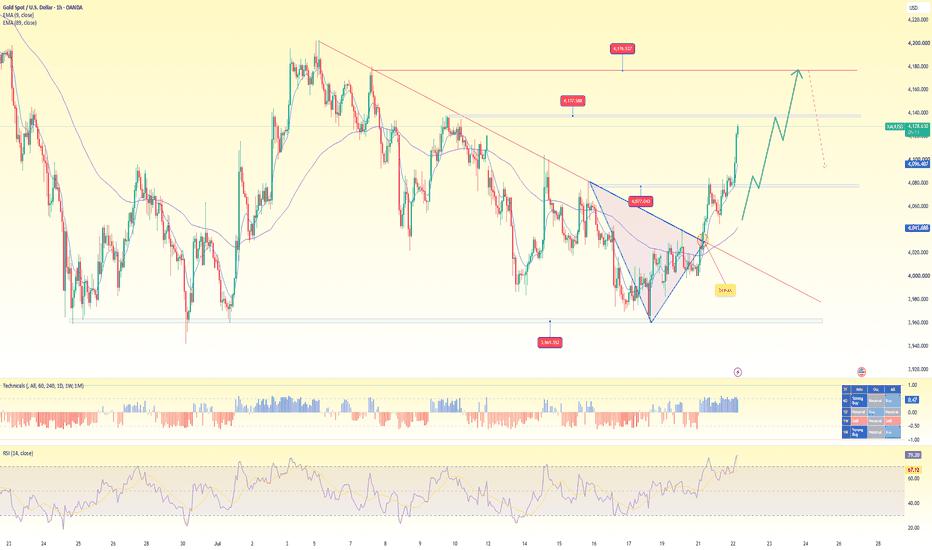
Price has broken above the descending trendline that had been in place since the beginning of the month.
It has also broken out of a descending triangle / falling wedge pattern (the circled area on the chart).
EMA 9 = 4,096 is positioned above EMA 89 = 4,041, confirming bullish momentum.
RSI (14) = 79, indicating that the market is very strong but has also entered the overbought zone.
👉 Conclusion: Buyers are currently in control of the H1 trend. However, after such a steep rally, the probability of a technical pullback is relatively high before the uptrend continues.
2. Current Outlook
Gold is currently in a strong bullish phase following the breakout of a bearish structure. The higher-probability scenario is a short-term pullback toward 4,080, followed by a continuation move toward 4,176.
The current bullish structure would only be invalidated if an H1 candle closes below 4,020.
3. Resistance Levels
Immediate resistance: 4,137 – 4,140
Major resistance: 4,176 – 4,180
4. Support Levels
Immediate support: 4,077 – 4,080
Dynamic support: EMA 89 around 4,041 – 4,045
Strong demand zone: 4,020 – 4,030
--------------
SELL GOLD zone : 4176 - 4179
SL : 4184
TP : 4160 - 4132 - 4105
----------------
Tuyên bố miễn trừ trách nhiệm: Quan điểm được trình bày hoàn toàn là của tác giả và không đại diện cho quan điểm chính thức của Followme. Followme không chịu trách nhiệm về tính chính xác, đầy đủ hoặc độ tin cậy của thông tin được cung cấp và không chịu trách nhiệm cho bất kỳ hành động nào được thực hiện dựa trên nội dung, trừ khi được nêu rõ bằng văn bản.
 Chưa có bình luận nào. Hãy là người đầu tiên chia sẻ ý kiến của bạn.