


- AUD/USD recedes from 0.6900 to print two-day losing streak.
- MACD flirts with the bears, signals 100-bar SMA retest before highlight the key Fibonacci retracements.
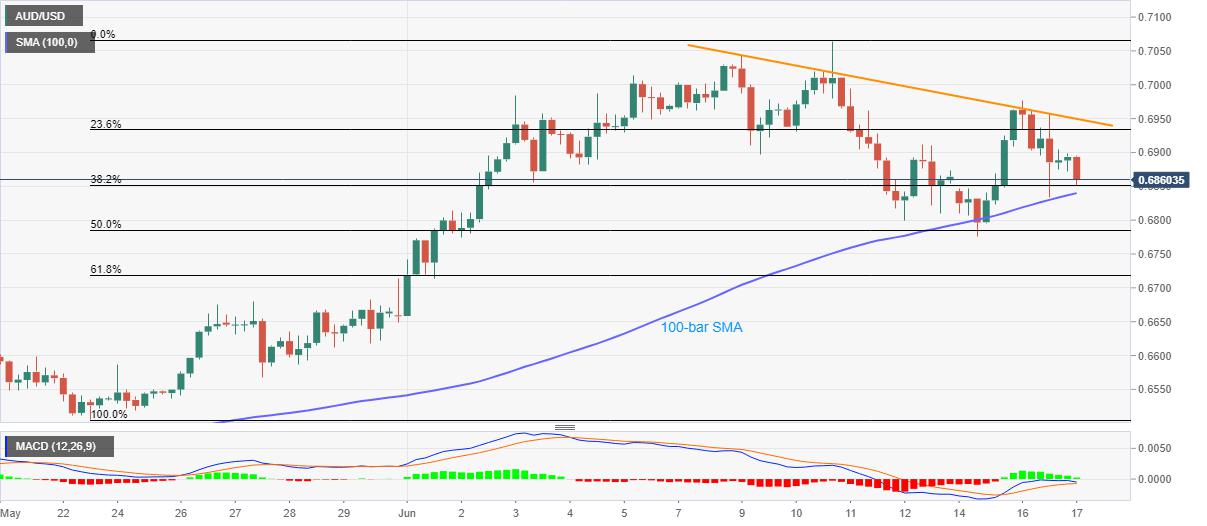
- A falling trend line from June 09 holds the door for the fresh run-up to challenge the monthly top.
AUD/USD bounces off intraday low of 0.6852 to 0.6863 during the early Wednesday’s trading session. Even so, the pair drops 0.36% on a day while printing a two-day losing streak by the press time.
The Aussie pair has recently been compressed by the weekly resistance line, which in turn tracks the MACD histogram that signals the receding strength of the buyers.
As a result, the quote could revisit a 100-bar SMA level of 0.6840 whereas the further declines depend upon how well it breaks 50% Fibonacci retracement level of its May 22-June 07 upside, also comprising the weekly low near 0.6775.
Should the AUD/USD prices remain weak past-0.6775, 61.8% Fibonacci retracement level near 0.6720 will be the key as a break of which could aim for May 27 high of 0.6680.
Meanwhile, the pair’s upside clearance of the said resistance line, at 0.6950 now, enables it to challenge the 0.7000 threshold. Additionally, a sustained rise beyond 0.7000 could easily refresh the monthly top surrounding 0.7065.
AUD/USD four-hour chart
Trend: Further downside expected
Được in lại từ FXStreet, bản quyền được giữ lại bởi tác giả gốc.
Tuyên bố miễn trừ trách nhiệm: Quan điểm được trình bày hoàn toàn là của tác giả và không đại diện cho quan điểm chính thức của Followme. Followme không chịu trách nhiệm về tính chính xác, đầy đủ hoặc độ tin cậy của thông tin được cung cấp và không chịu trách nhiệm cho bất kỳ hành động nào được thực hiện dựa trên nội dung, trừ khi được nêu rõ bằng văn bản.
 Chưa có bình luận nào. Hãy là người đầu tiên chia sẻ ý kiến của bạn.