


MCD looks set to correct the full advance that began in 2020. Moreover, price action already signals a developing Wave (II) retracement. The structure shows a clear break in momentum, confirming pressure on the larger cycle. Technically, MCD holds initial support near $245, while it stays below the 50‑day average.
Looking ahead, Wave (II) should target the key Fibonacci retracement zones of the 2020 cycle. Still, the bullish trend remains valid while the 2020 origin stays intact. As a result, traders expect a multi‑month pullback before Wave (III) resumes. A sustained drop under $245 would strengthen the Wave (II) outlook.
Elliott Wave Outlook: McDonald's MCD Weekly Chart April 2026
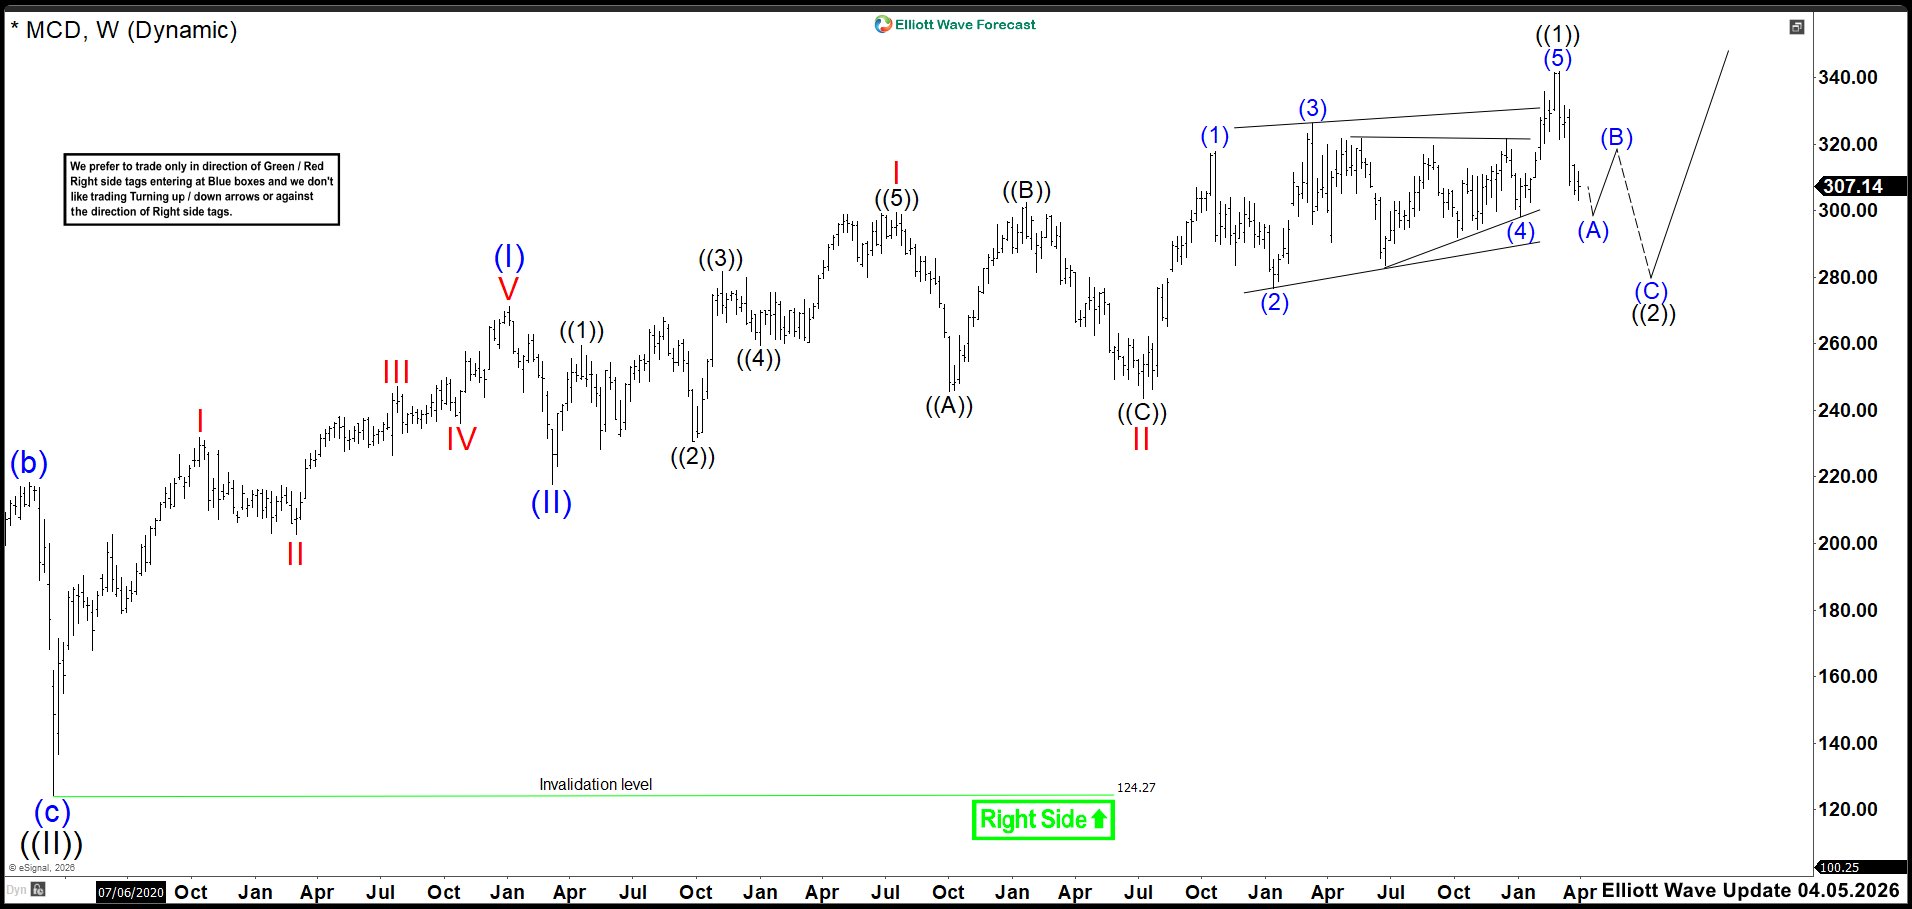
Back in April, we expected MCD to finish its higher high and complete the leading diagonal. Moreover, we anticipated a pullback that would confirm the start of wave ((2)). Price delivered that reaction, yet the corrective structure still looks incomplete. Therefore, we expect continued downside before wave ((2)) fully resolves. The decline could extend into the 292.59–280.99 zone, where wave ((2)) should finish.
After that, the broader bullish cycle should resume, but the process may take months. Consequently, we must stay patient and wait for price to reach the projected support zone. We avoid forcing trades and let the market define the next opportunity.
(If you want to learn more about Elliott Wave Principle, please follow these links: Elliott Wave Education and Elliott Wave Theory.)
Elliott Wave Principle Behind the Market Structure
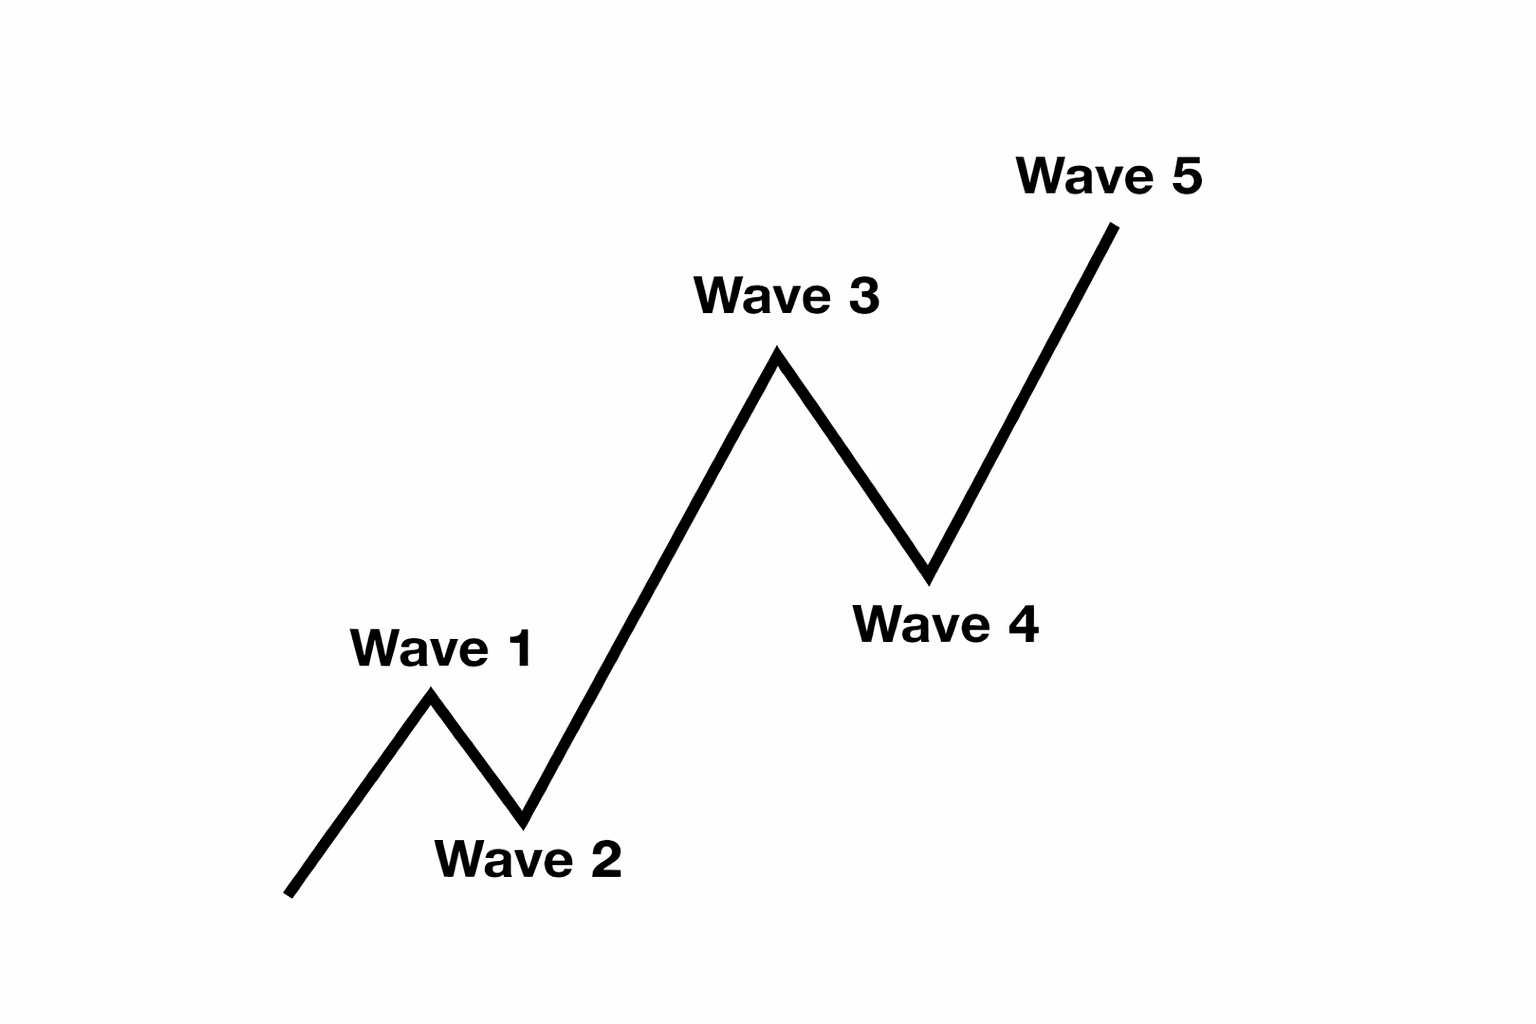
Impulse
An impulse is a clean 5‑wave pattern that drives the trend forward.
- Waves 1‑3‑5 are strong and directional.
- No overlap between waves 1 and 4.
- Wave 3 is usually the strongest.
- Structure is clear, with increasing momentum.
Elliott Wave Outlook: McDonald's MCD Weekly Chart July 2026
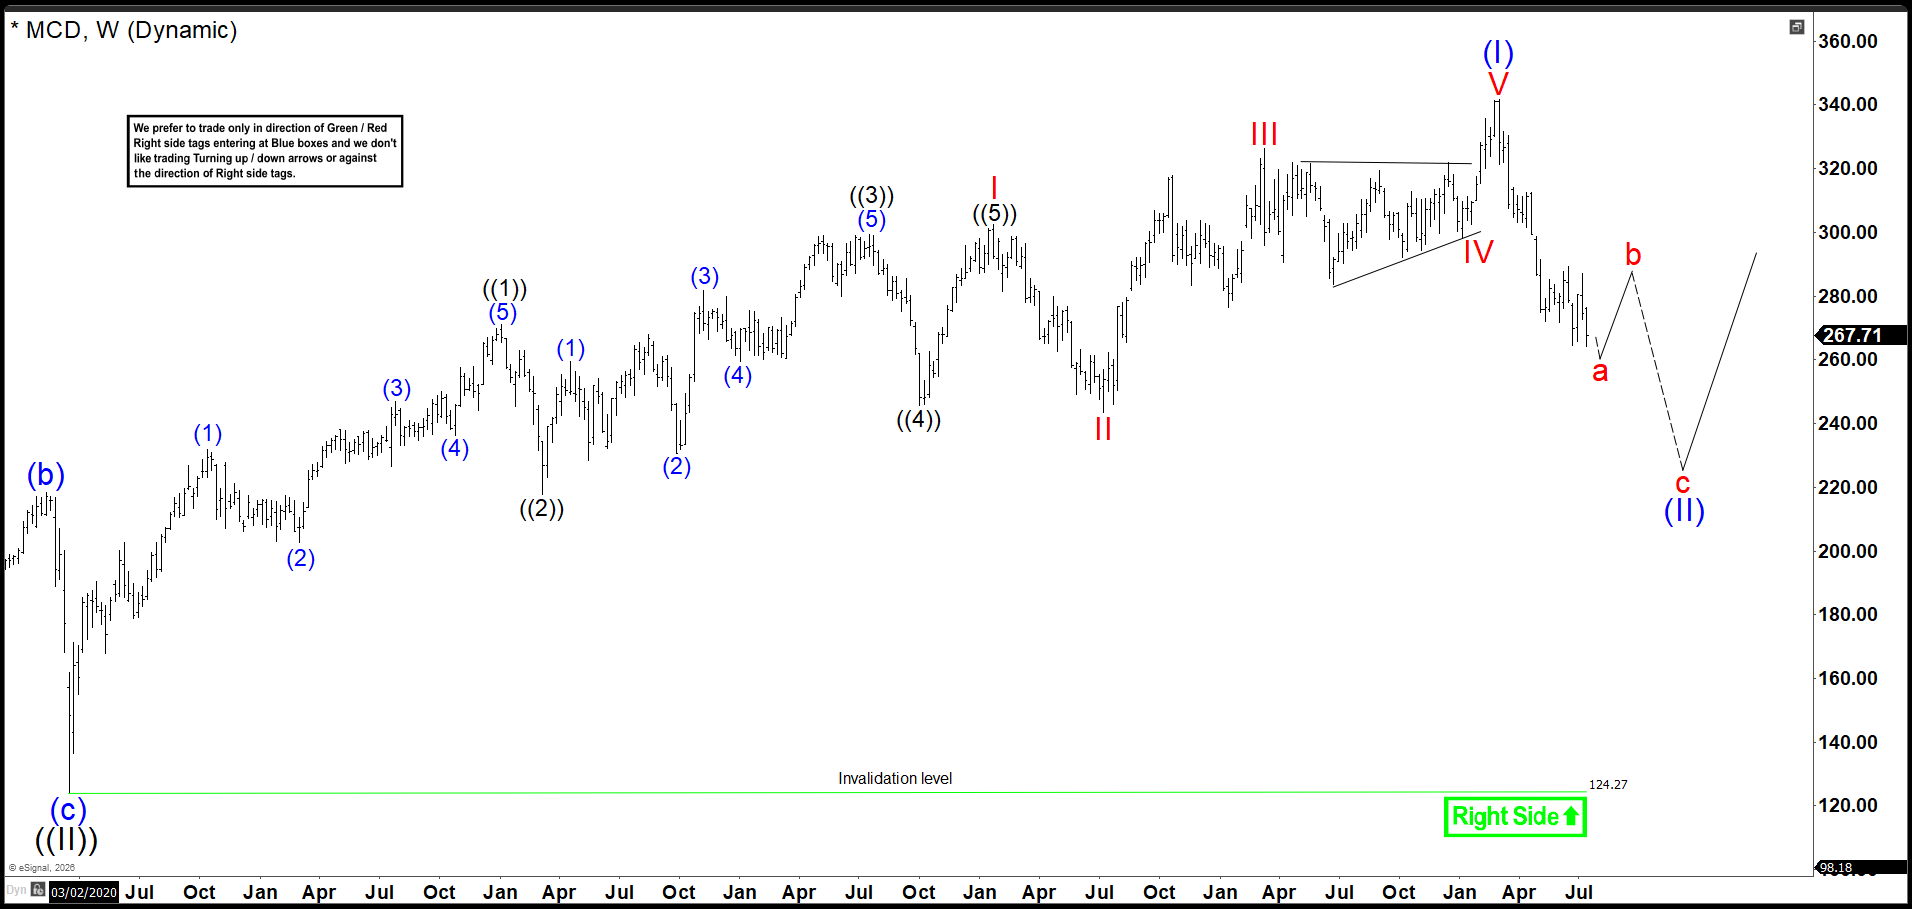
The latest update shows the decline keeps extending, which suggests MCD may be correcting the full cycle from the 2020 low. Therefore, I removed the triple nest and labeled a leading diagonal as wave (I). Now we should expect a rebound soon, which implies the market trades in wave b, which should fail and allow wave c of (II) to continue lower.
This correction could reach the 259.00–207.56 area. If we see a rebound there, the rally may resume and confirm the broader bullish continuation.
Tuyên bố miễn trừ trách nhiệm: Quan điểm được trình bày hoàn toàn là của tác giả và không đại diện cho quan điểm chính thức của Followme. Followme không chịu trách nhiệm về tính chính xác, đầy đủ hoặc độ tin cậy của thông tin được cung cấp và không chịu trách nhiệm cho bất kỳ hành động nào được thực hiện dựa trên nội dung, trừ khi được nêu rõ bằng văn bản.
 Chưa có bình luận nào. Hãy là người đầu tiên chia sẻ ý kiến của bạn.
