Mastercard Inc (NYSE: MA) is undergoing a weekly correction. Today, we dive into its technical chart. Our analysis explores the Elliott Wave structure and projected target for the current cycle.
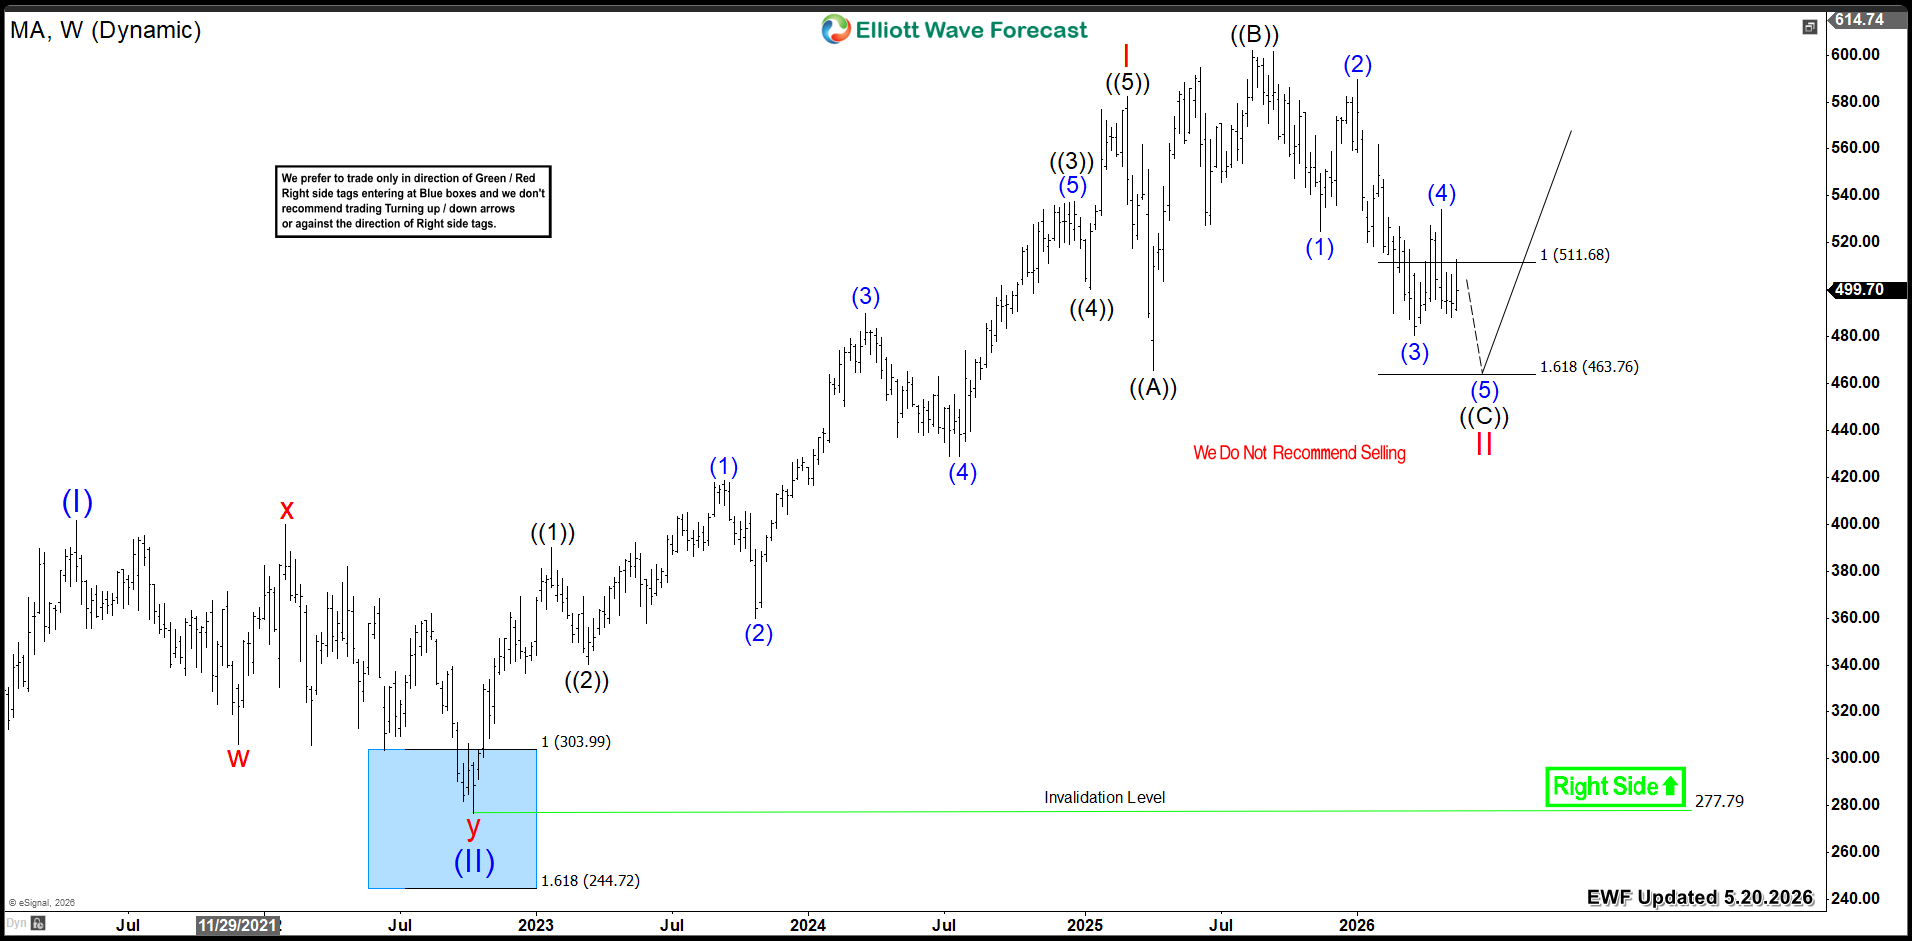
MA completed an impulsive five-wave advance from its 2022 low of 277.79. Wave I peaked at $582. From that high, a three-wave flat correction is now unfolding. Wave ((A)) ended at 465. Then, Then, wave ((B)) reached $601. Currently, wave ((C)) remains in progress.
The stock already reached the equal legs zone ( $511 − $463) . This area should conclude wave II. Consequently, a bullish reversal will take place from this zone and Mastercard will look to resume the rally higher in wave III into new all time highs.
Mastercard (MA) Weekly Chart 5.20.2026
Conclusion
Mastercard's (MA) bullish cycle remains in progress. The stock is poised for further upside extension. Therefore, investors should target buying opportunities within weekly pullbacks.
Tuyên bố miễn trừ trách nhiệm: Quan điểm được trình bày hoàn toàn là của tác giả và không đại diện cho quan điểm chính thức của Followme. Followme không chịu trách nhiệm về tính chính xác, đầy đủ hoặc độ tin cậy của thông tin được cung cấp và không chịu trách nhiệm cho bất kỳ hành động nào được thực hiện dựa trên nội dung, trừ khi được nêu rõ bằng văn bản.

Để lại tin nhắn của bạn ngay bây giờ