


Market Structure Breakdown
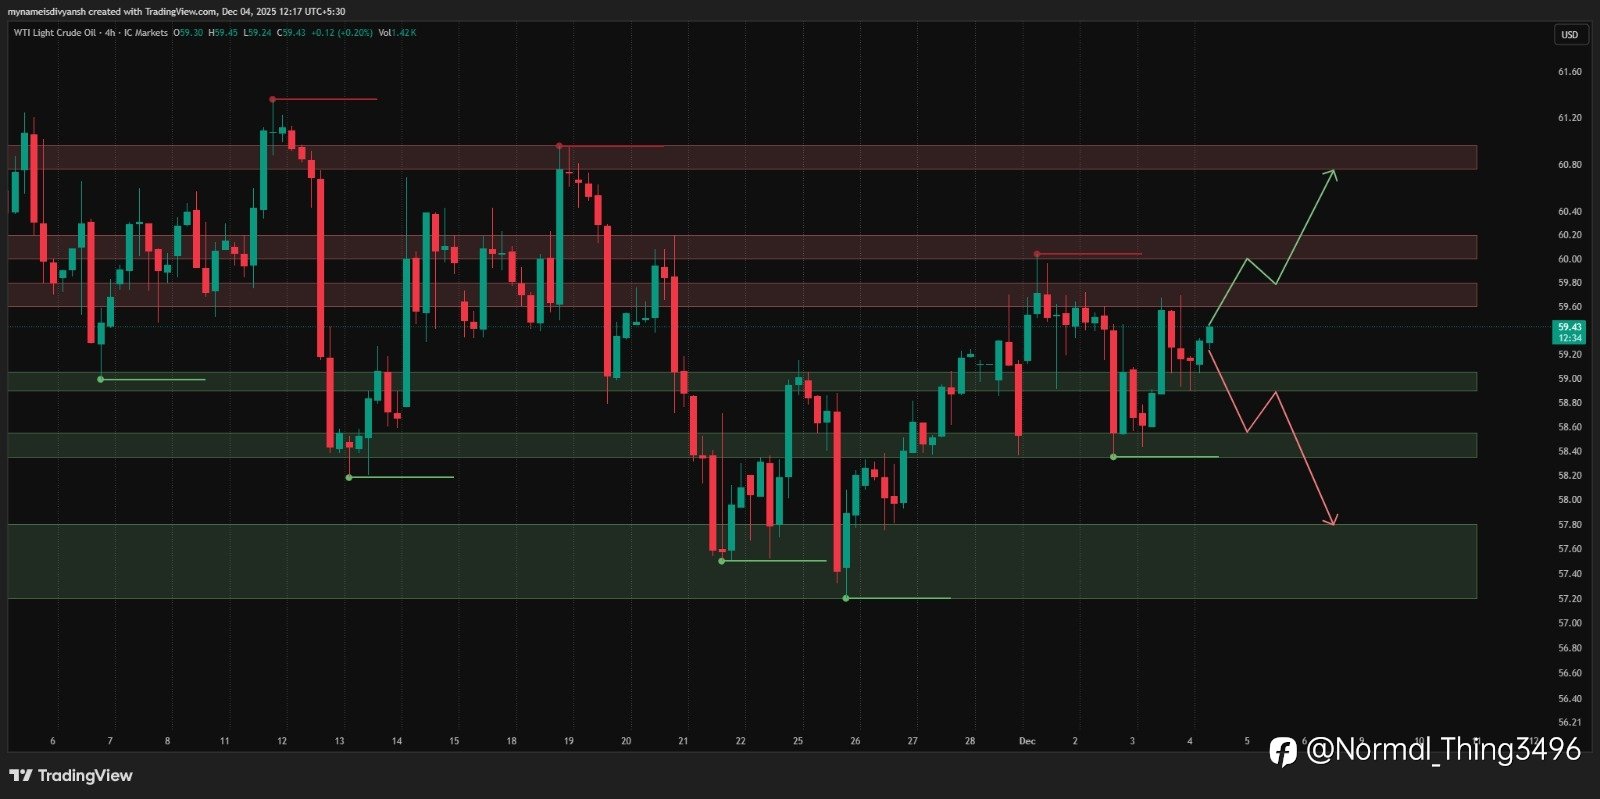
Crude oil remains under pressure, with the higher-timeframe downtrend still firmly in play. On weekly and daily charts, price continues to trade inside the broader discount range at 58–57, signaling that the market is not yet ready to shift bullish.
Shorter timeframes tell the same story. The 4H/2H structure continues printing lower highs, and every rally into 59.80–60.20 has been aggressively sold. Even on the 1H/15M, momentum slows sharply into 59.60–59.80, confirming a clear supply zone overhead.
Resistance Zones
• 59.60–59.80
• 59.90–60.20
• 60.75–60.95
Support Zones
• 59.05–58.90
• 58.55–58.35
• 57.80–57.20
With equal highs sitting above 59.60–59.80, price may engineer a small liquidity grab into 59.70–59.80 before sellers return. That’s the preferred short zone if price confirms rejection.
Longs remain risky. Buyers should only consider entries if oil dips back into 59.05–58.90 and prints a strong bullish reaction — otherwise, the dominant trend favors sellers.
For Trades : https://t.co/PUntR5EMpS
Tuyên bố miễn trừ trách nhiệm: Quan điểm được trình bày hoàn toàn là của tác giả và không đại diện cho quan điểm chính thức của Followme. Followme không chịu trách nhiệm về tính chính xác, đầy đủ hoặc độ tin cậy của thông tin được cung cấp và không chịu trách nhiệm cho bất kỳ hành động nào được thực hiện dựa trên nội dung, trừ khi được nêu rõ bằng văn bản.
 Chưa có bình luận nào. Hãy là người đầu tiên chia sẻ ý kiến của bạn.
