


PENDLE is a DeFi protocol focused on yield trading, allowing users to both fix or leverage their yield. In today’s blog, we’ll explain the daily Elliott Wave structure taking place and show the potential outcome for the token.
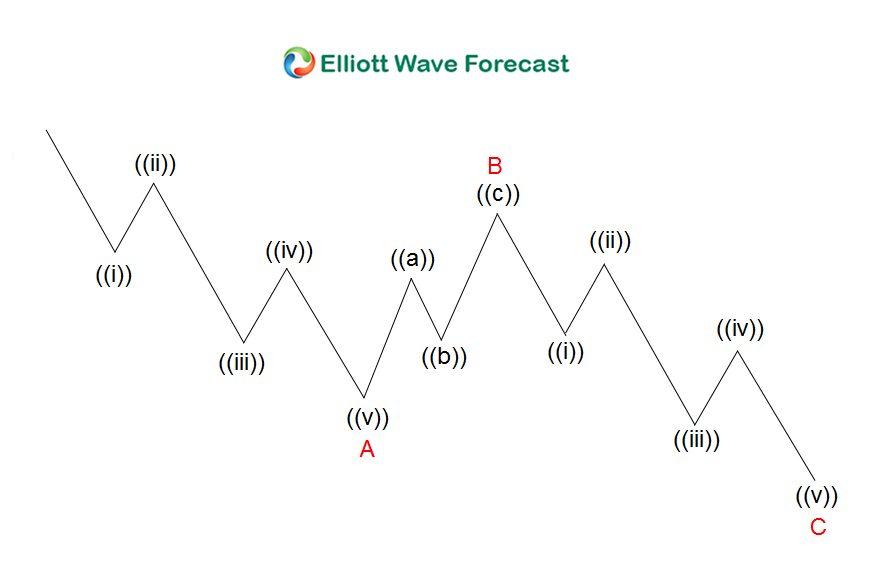
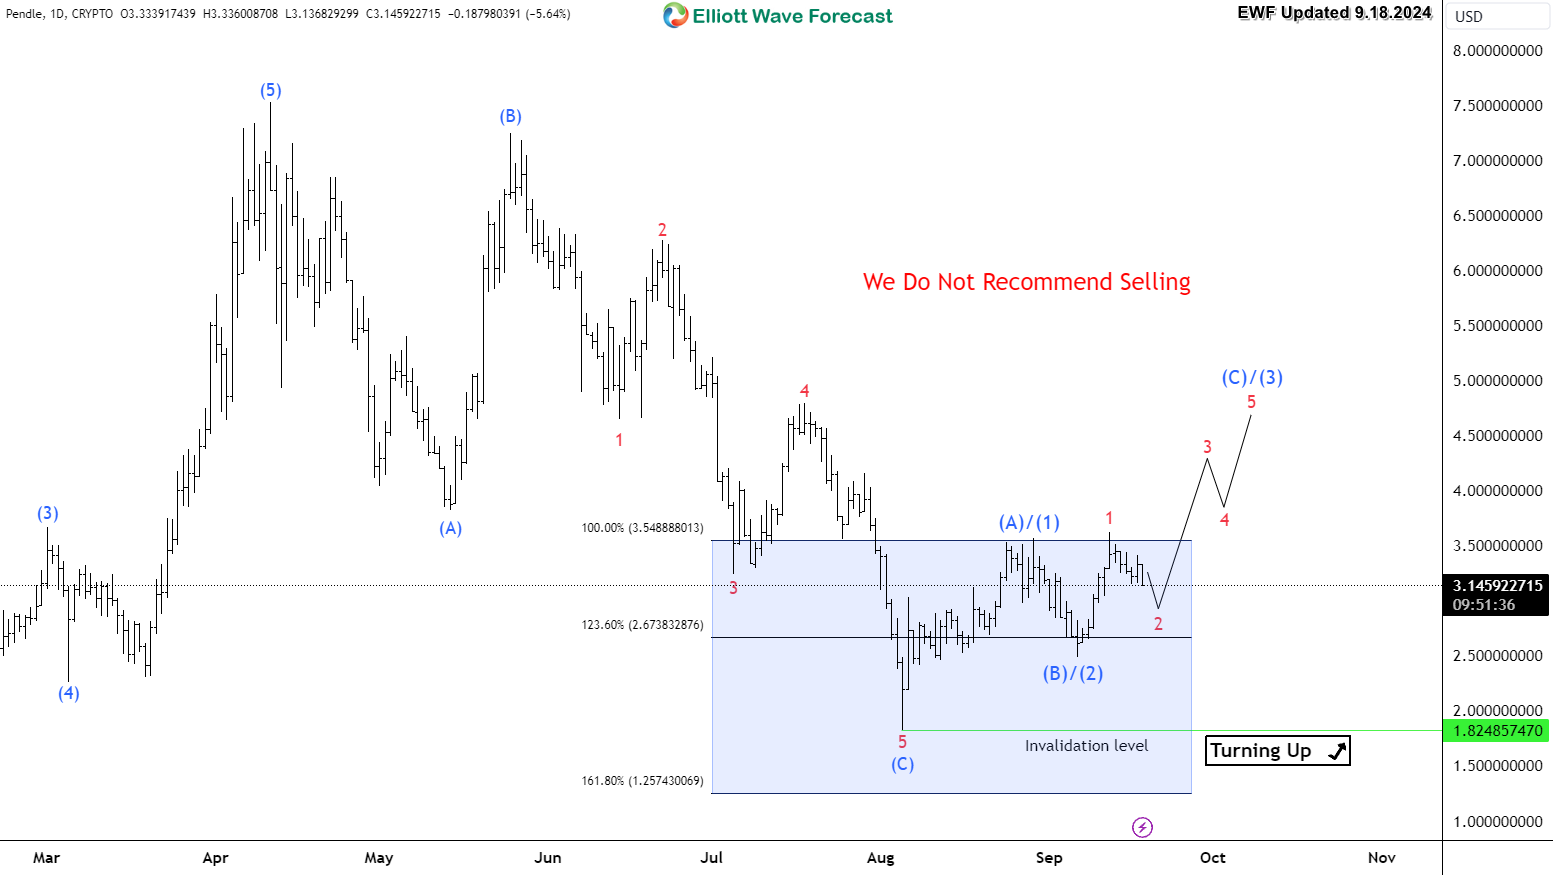
Since April 2024, PENDLE started its correction to the downside and it lost 75% of its value. The move from the peak unfolded within a 3 waves ZigZag structure. This Elliott Wave corrective structure results on a reversal to take place. The token reached the equal legs area at $3.5 – $1.25 from where it ended the daily move to the downside.
The blue box showing in our chart is a technical area where we expect PENDLE to find Buyers and react higher. Up from there, it’s expected to turn to the upside either to start a new 5 waves advance or at least bounce in 3 waves from there.
Elliott Wave ZigZag Structure
PENDLE Daily Chart 9.18.2024
Tuyên bố miễn trừ trách nhiệm: Quan điểm được trình bày hoàn toàn là của tác giả và không đại diện cho quan điểm chính thức của Followme. Followme không chịu trách nhiệm về tính chính xác, đầy đủ hoặc độ tin cậy của thông tin được cung cấp và không chịu trách nhiệm cho bất kỳ hành động nào được thực hiện dựa trên nội dung, trừ khi được nêu rõ bằng văn bản.
 Chưa có bình luận nào. Hãy là người đầu tiên chia sẻ ý kiến của bạn.