


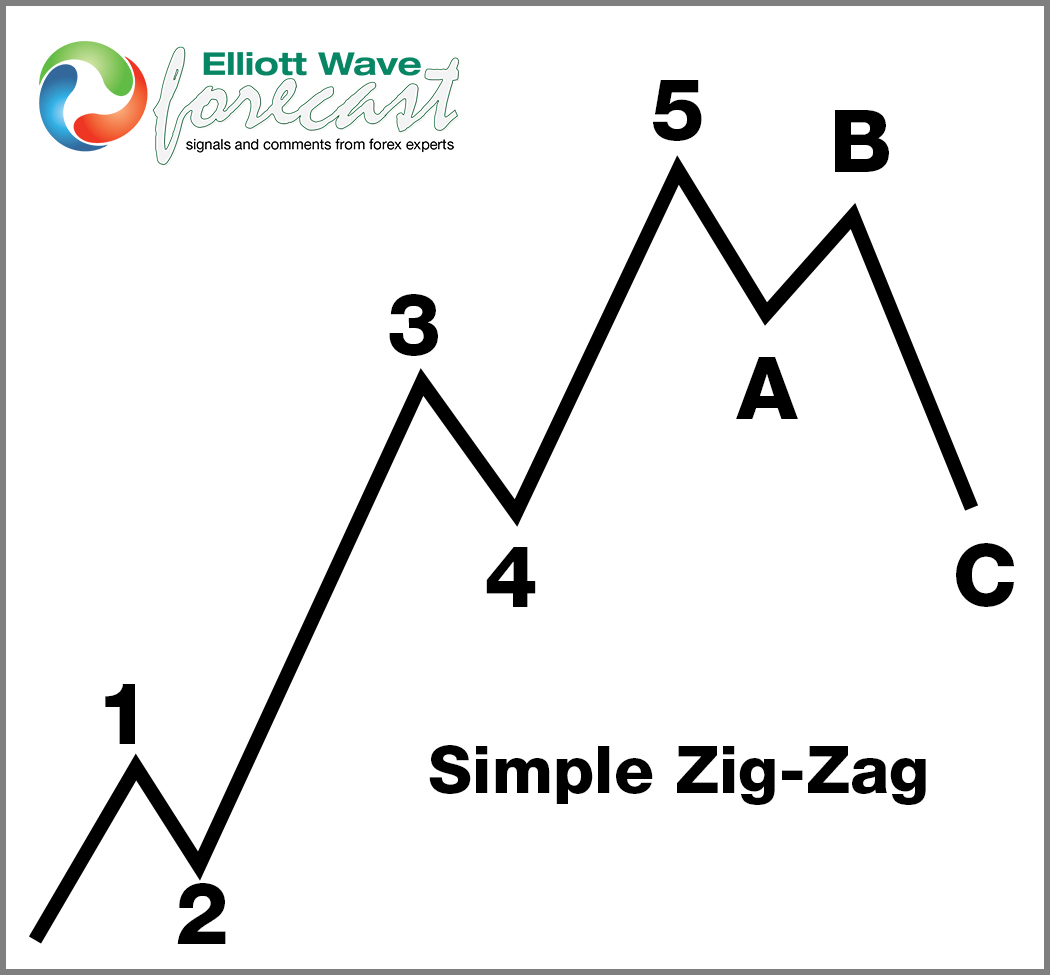
Hello everyone! In today’s article, we will look at the past performance of the 1H Hour Elliott Wave chart of Tesla Inc. ($TSLA). The rally from 6.11.2024 low at $167.40 unfolded as 5 waves impulse. So, we expected the pullback to unfold in 3 swings and find buyers again. We will explain the structure & forecast below:
5 Wave Impulse Structure + ABC correction
$TSLA 1H Elliott Wave Chart 6.14.2024:
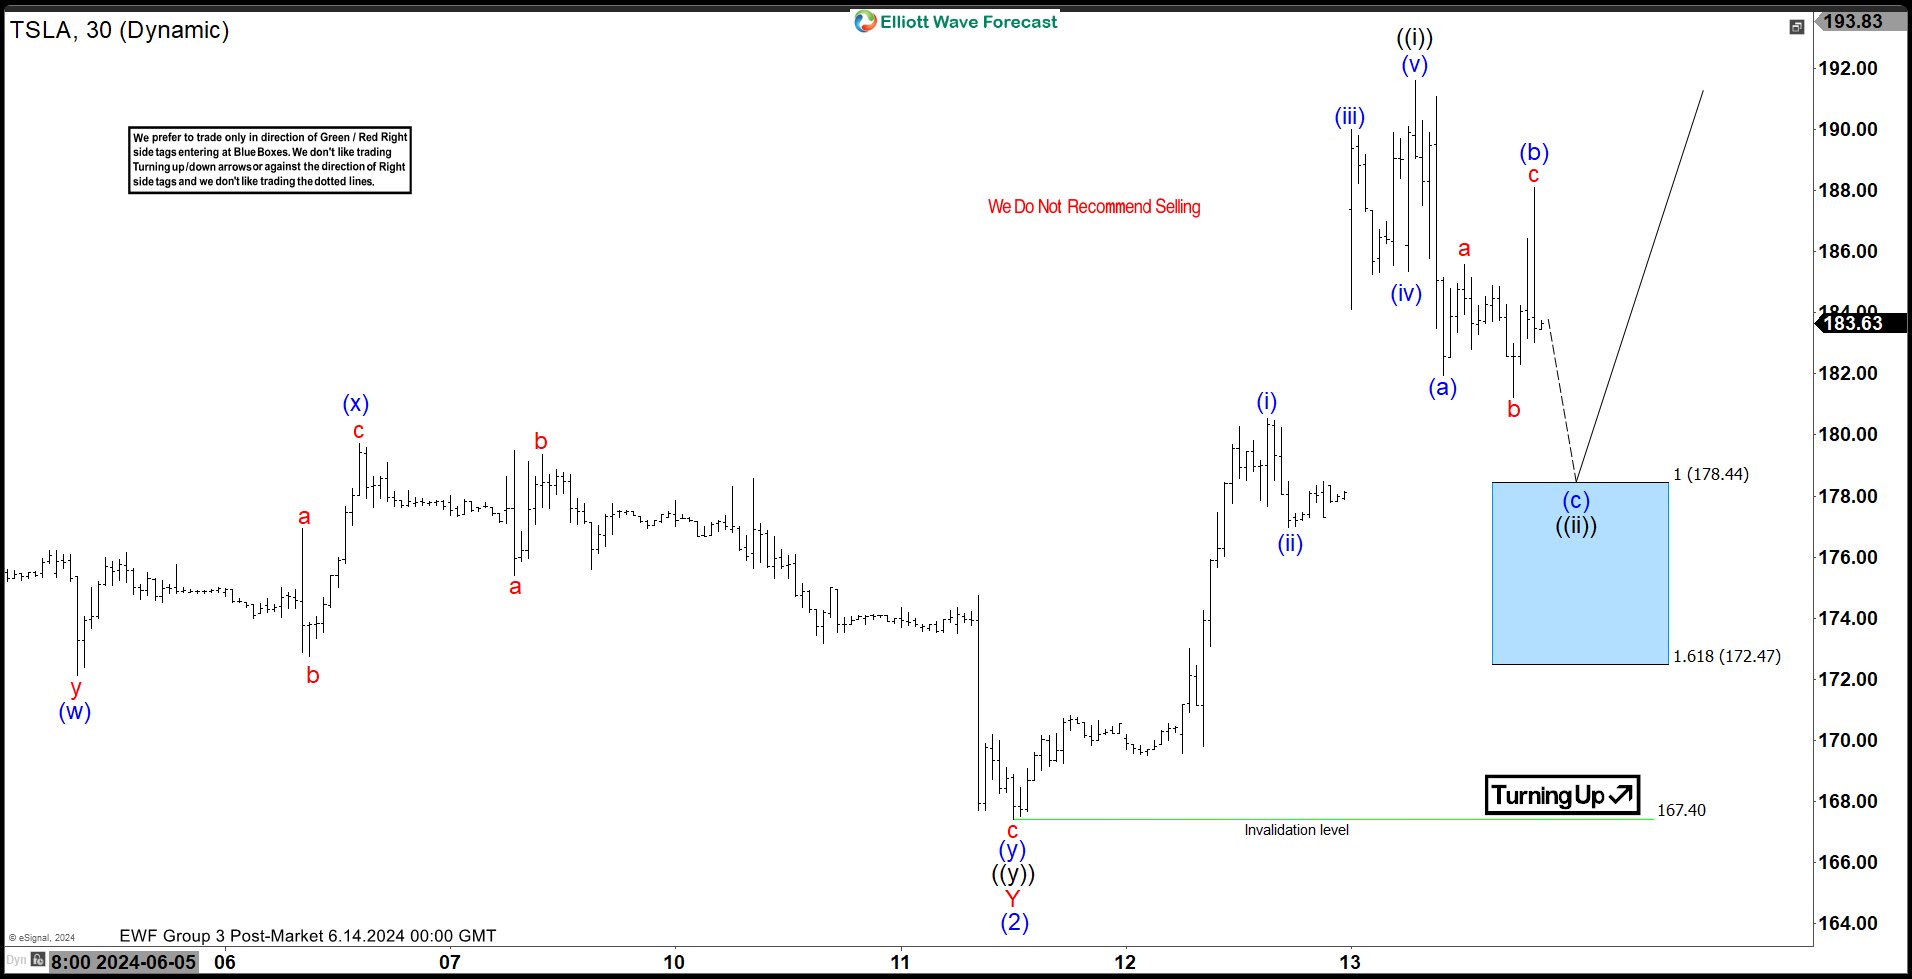
Here is the 1H Elliott Wave count from 6.14.2024. We expected the pullback to find buyers at the blue box area at 178.44 – 172.47 in 3 swings.
$TSLA 1H Elliott Wave Chart 7.02.2024:
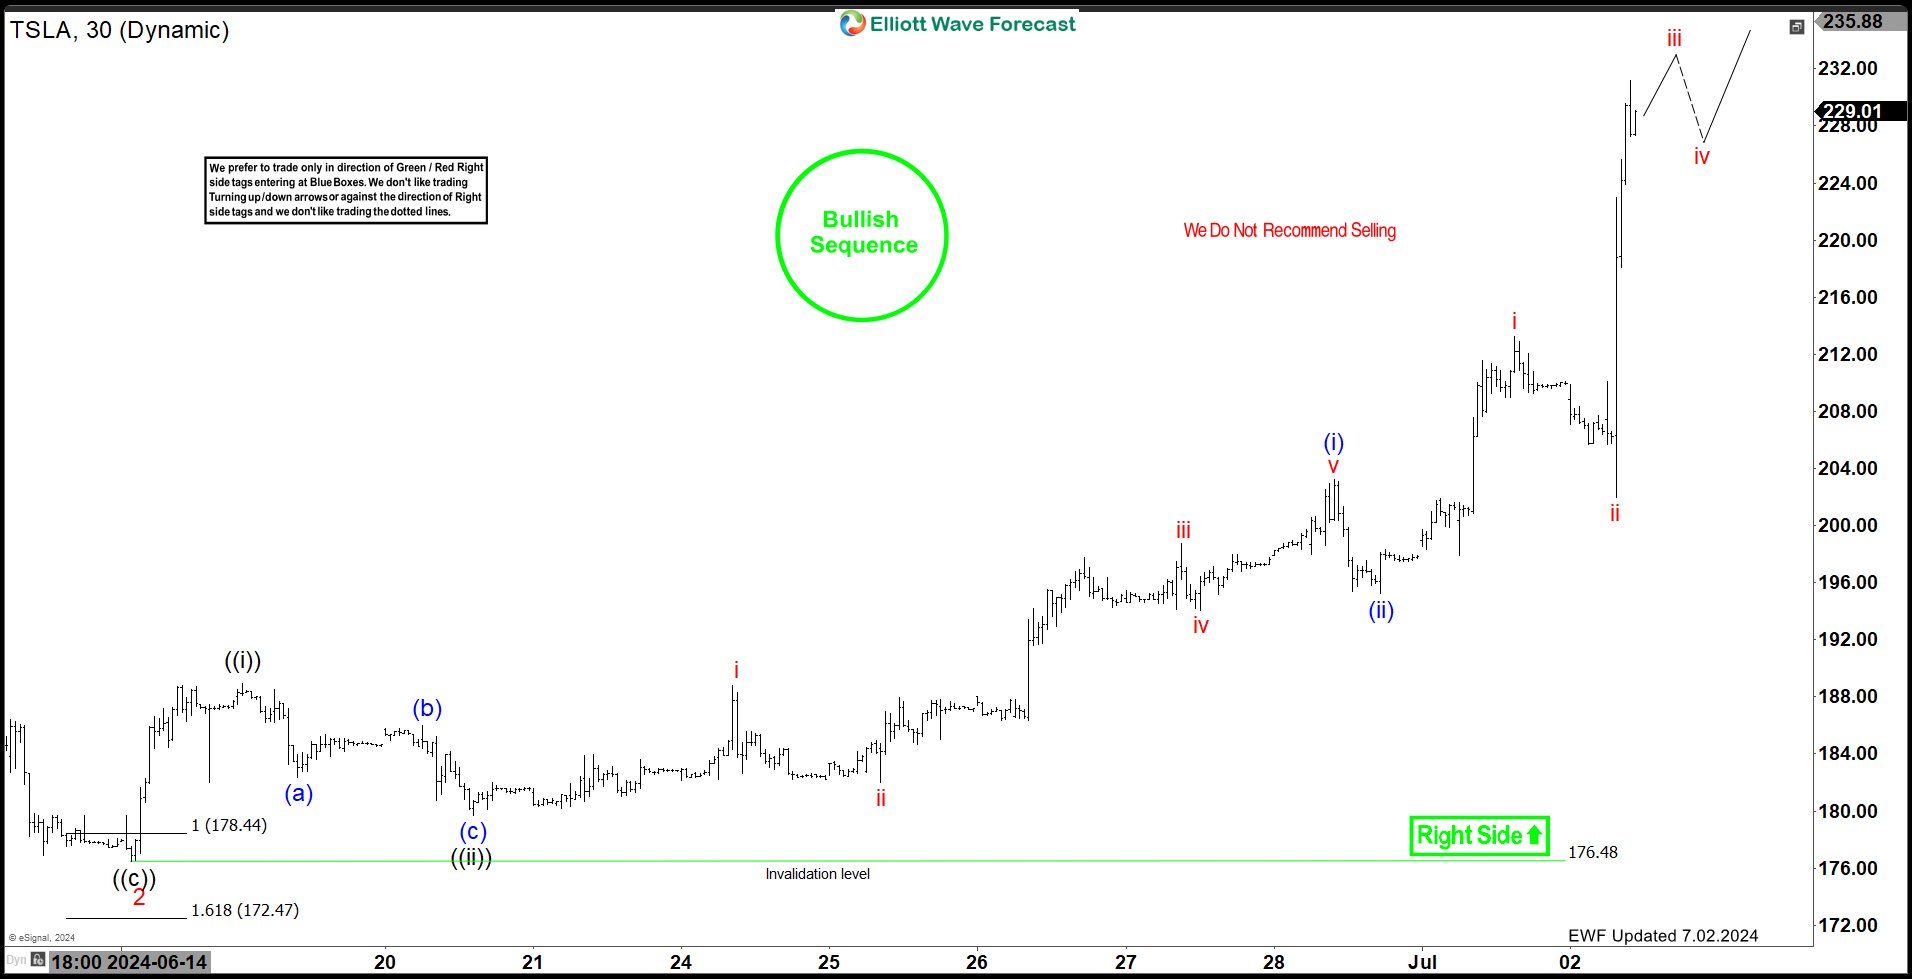 Here is the latest 1H update from 7.02.2024, showing the rally taking place as expected. The stock has reacted higher from the blue box area allowing longs to get risk free. The stock has reached the first target area at $227 where traders can book profits. The next target higher is $335 area and eventually new all time highs.
Tuyên bố miễn trừ trách nhiệm: Quan điểm được trình bày hoàn toàn là của tác giả và không đại diện cho quan điểm chính thức của Followme. Followme không chịu trách nhiệm về tính chính xác, đầy đủ hoặc độ tin cậy của thông tin được cung cấp và không chịu trách nhiệm cho bất kỳ hành động nào được thực hiện dựa trên nội dung, trừ khi được nêu rõ bằng văn bản.
 Chưa có bình luận nào. Hãy là người đầu tiên chia sẻ ý kiến của bạn.