
WELLS FARGO & CO.: TECHNICAL ANALYSIS

avatar
· Views 140


WELLS FARGO & CO.: TECHNICAL ANALYSIS
Scenario
TimeframeWeekly
RecommendationBUY STOP
Entry Point61.20
Take Profit67.00
Stop Loss60.00
Key Levels55.30, 56.00, 58.30, 60.00, 61.20, 61.50, 64.00, 67.00
Alternative scenario
RecommendationSELL STOP
Entry Point58.30
Take Profit55.30
Stop Loss60.00
Key Levels55.30, 56.00, 58.30, 60.00, 61.20, 61.50, 64.00, 67.00

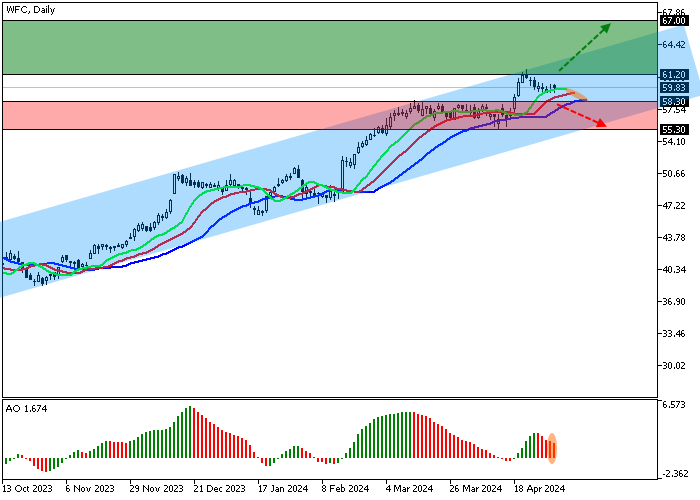
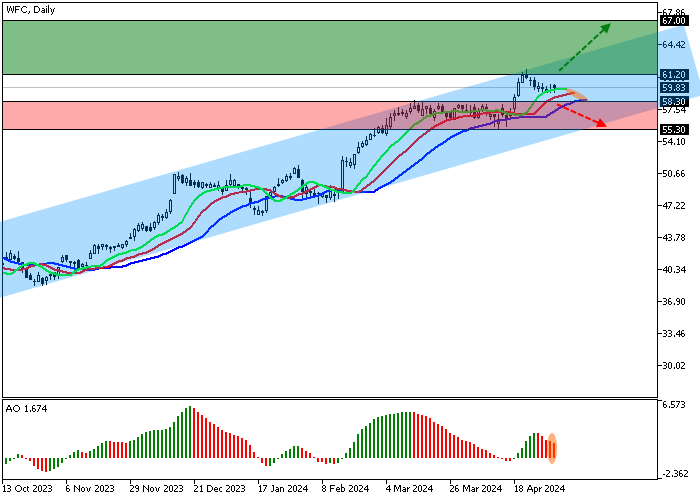
Shares of Wells Fargo & Co., one of the leading banking and insurance companies in the United States, are corrected at 60.00.

On the daily chart, the price stays within the ascending corridor of 64.00–56.00.

On the four-hour chart, the quotes reached the channel resistance line of 61.50 and began to form a corrective Flag pattern with an implementation level of 61.20, and if implemented, the asset could reach 67.00.

Technical indicators are weakening the buy signal: fast EMA of the Alligator indicator are above the signal line, narrowing the range of fluctuations, and the AO histogram is forming corrective bars above the transition level.

WELLS FARGO & CO.: TECHNICAL ANALYSIS

Trading tips

Long positions may be opened after the price rises and consolidates above 61.20, with the target at 67.00. Stop loss – 60.00. Implementation period: 7 days or more.

Short positions may be opened after the price declines and consolidates below 58.30, with the target at 55.30. Stop loss – 60.00.


Tuyên bố miễn trừ trách nhiệm: Quan điểm được trình bày hoàn toàn là của tác giả và không đại diện cho quan điểm chính thức của Followme. Followme không chịu trách nhiệm về tính chính xác, đầy đủ hoặc độ tin cậy của thông tin được cung cấp và không chịu trách nhiệm cho bất kỳ hành động nào được thực hiện dựa trên nội dung, trừ khi được nêu rõ bằng văn bản.

Bạn thích bài viết này? Hãy thể hiện sự cảm kích của bạn bằng cách gửi tiền boa cho tác giả.
Trả lời 0
Chưa có bình luận nào. Hãy là người đầu tiên chia sẻ ý kiến của bạn.

  • tradingContest