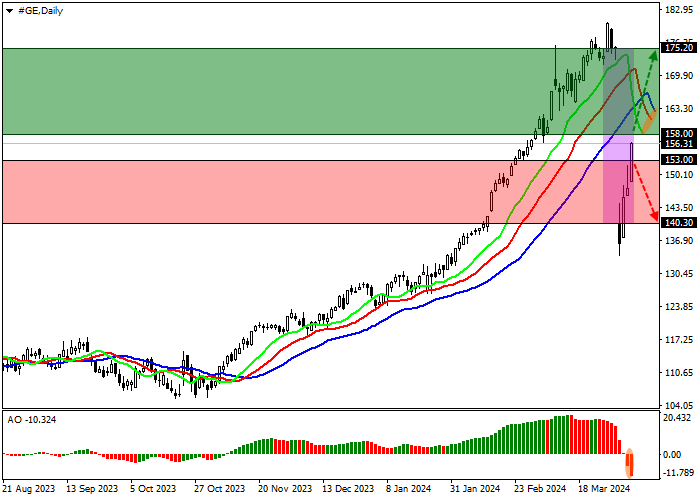
Shares of General Electric Co., an American diversified corporation, are trading at 156.00.
On the daily chart, the price is moving in a corrective trend, working out the price gap of 175.00–140.00.
On the four-hour chart, the quotes have consolidated above the resistance level of 150.00, and the only obstacle to further growth is the high of 163.00, consolidation above which will allow the asset to reach the opening price gap level of 175.00.
Technical indicators are holding a sell signal: fast EMA on the Alligator indicator are above the signal line, preparing to begin narrowing the range, and the AO histogram is forming corrective bars in the sell zone.
Trading tips
Long positions may be opened after the price rises and consolidates above 158.00, with the target at 175.00. Stop loss – 155.00. Implementation period: 7 days or more.
Short positions may be opened after the price declines and consolidates below 153.00, with the target at 140.30. Stop loss – 157.00.



 Chưa có bình luận nào. Hãy là người đầu tiên chia sẻ ý kiến của bạn.
