


Mastercard Incorporated (NYSE: MA), a global leader in payment technology, continues to navigate the ever-evolving landscape of financial transactions. As digital payments become increasingly integral to modern economies, Mastercard remains at the forefront of innovation. This article dives into the recent technical developments and potential trajectories within its daily cycle using Elliott Wave Theory.
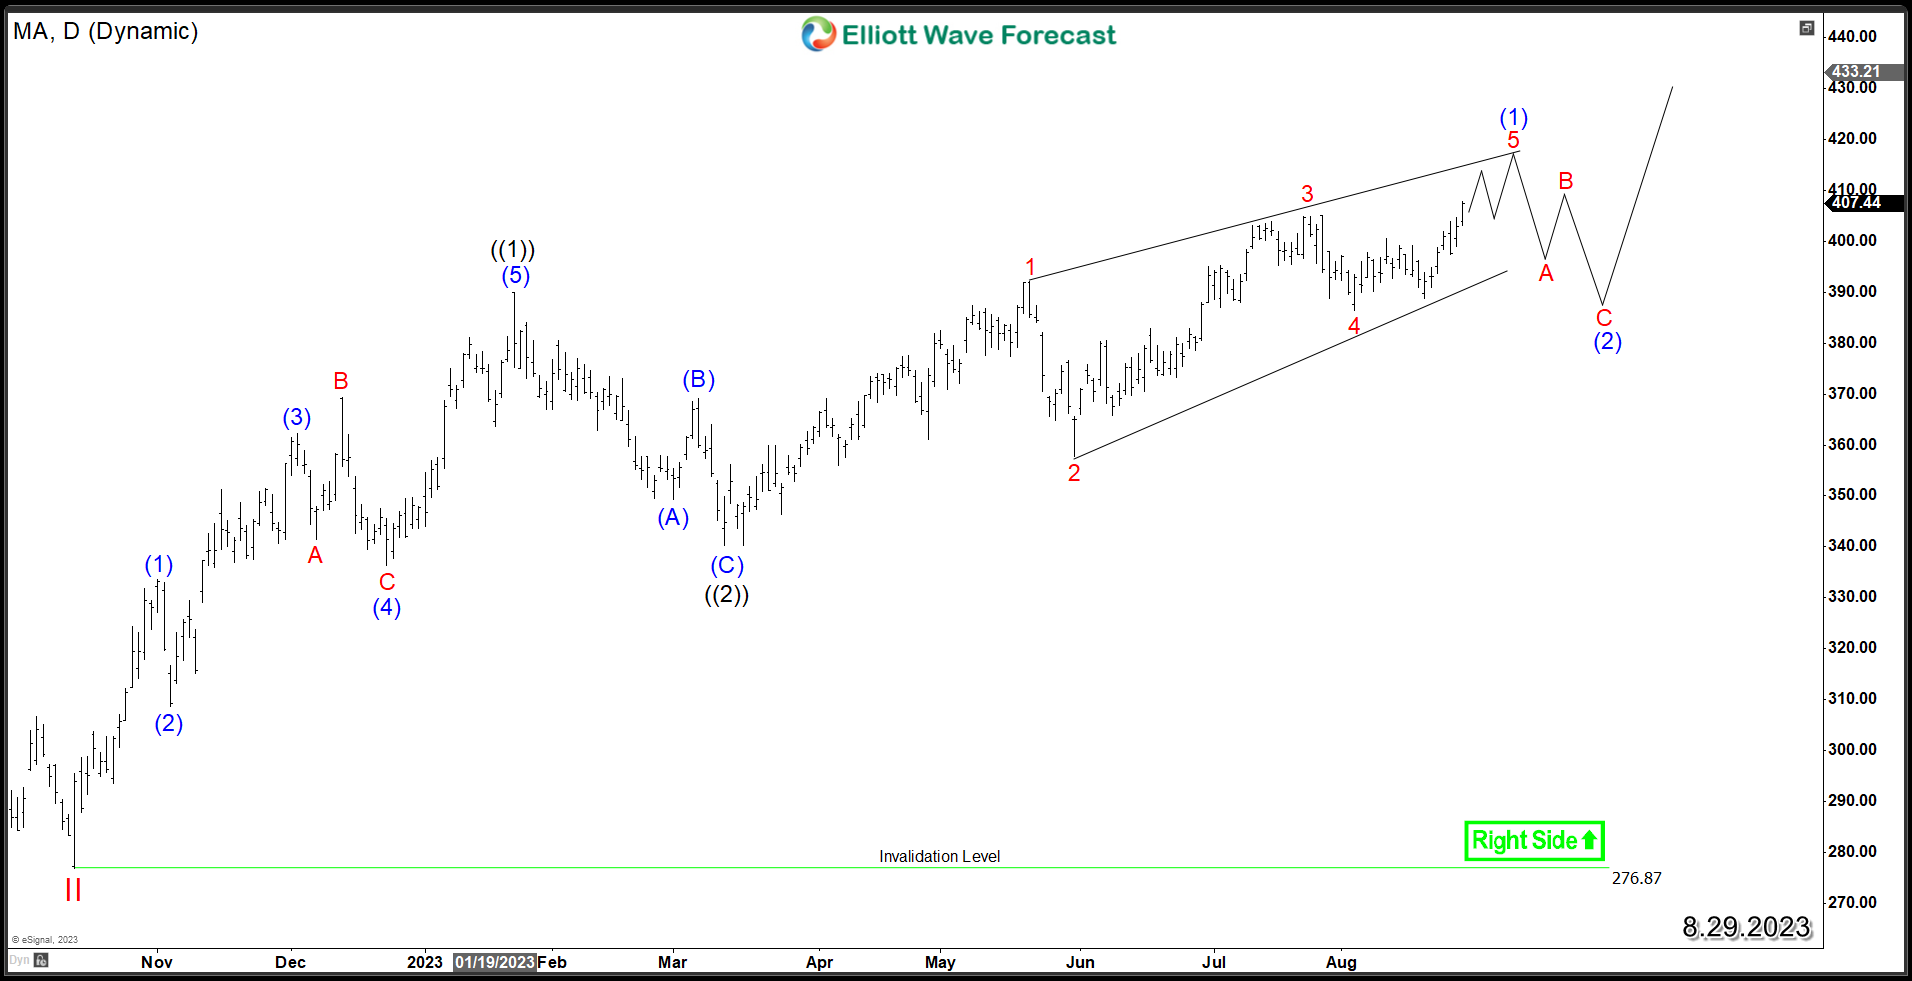
Last month, Mastercard reached a new all-time high, surpassing the 2021 peak of $401. This ascent followed a previously identified bullish sequence from the October 2022 low. The higher high sequence implies a target around $452 - $522. The stock's journey to this range hinges on the daily cycle's structure.
The current movement is likely part of a nesting structure, possibly involving a leading diagonal in wave (1), projected to conclude near the 61.8% Fibonacci Extension area of $410 - $426. Subsequently, a three-wave pullback within wave (2) is anticipated, with support anticipated above the March 2023 low of $340.
Alternatively, if the upcoming move can erase the divergence compared to the July peak, Mastercard might initiate an accelerated ascent within wave (3), bypassing the necessity of a substantial pullback and potentially reaching the daily target at $452 directly.
Investors are advised to seize daily buying opportunities amid potential pullbacks, supporting further upward momentum within the existing bullish sequence for MA in the coming months.
Mastercard MA Daily Chart 8.29.2023
Tuyên bố miễn trừ trách nhiệm: Quan điểm được trình bày hoàn toàn là của tác giả và không đại diện cho quan điểm chính thức của Followme. Followme không chịu trách nhiệm về tính chính xác, đầy đủ hoặc độ tin cậy của thông tin được cung cấp và không chịu trách nhiệm cho bất kỳ hành động nào được thực hiện dựa trên nội dung, trừ khi được nêu rõ bằng văn bản.
 Chưa có bình luận nào. Hãy là người đầu tiên chia sẻ ý kiến của bạn.