


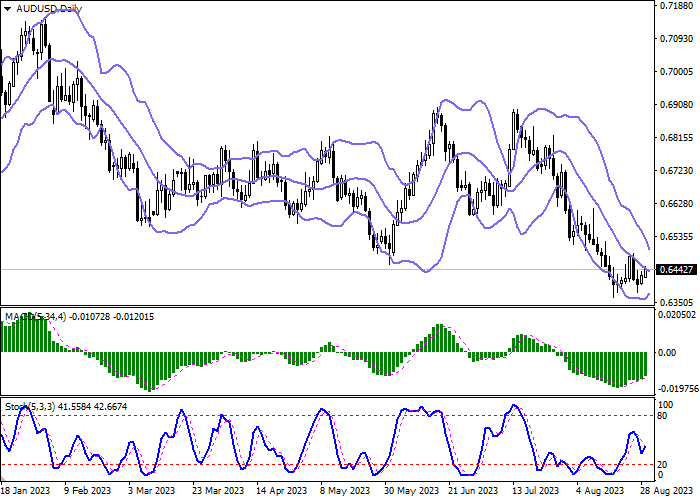
| Scenario | |
|---|---|
| Timeframe | Intraday |
| Recommendation | BUY STOP |
| Entry Point | 0.6455 |
| Take Profit | 0.6550 |
| Stop Loss | 0.6400 |
| Key Levels | 0.6200, 0.6271, 0.6345, 0.6400, 0.6450, 0.6500, 0.6550, 0.6594 |
| Alternative scenario | |
|---|---|
| Recommendation | SELL STOP |
| Entry Point | 0.6395 |
| Take Profit | 0.6300 |
| Stop Loss | 0.6450 |
| Key Levels | 0.6200, 0.6271, 0.6345, 0.6400, 0.6450, 0.6500, 0.6550, 0.6594 |
Current trend
The AUD/USD pair shows active growth, developing a corrective upward trend, which is formed at the beginning of this week. The instrument is testing the level of 0.6440 for a breakout, receiving support from technical factors.
This week, the US will publish statistics that may significantly affect the future decisions of the US Federal Reserve on interest rates. In particular, on Wednesday, markets expect the release of updated data on the dynamics of the US Gross Domestic Product (GDP) for the second quarter. It should be noted that market forecasts do not imply any changes compared to the previous estimate of 2.4%. At the same time, a report from the Automatic Data Processing (ADP) on Employment Change will be published: experts' forecasts suggest a sharp slowdown in dynamics from 324.0 thousand to 195.0 thousand. On Friday, the focus of investors' attention will shift to the August data on the labor market.
In turn, the instrument is supported at the beginning of the new week by optimistic statistics from Australia, which reflected an increase in Retail Sales by 0.5% in July after -0.8% in the previous month, while analysts expected only 0.3%. On Wednesday Australia will publish July data on the consumer prices: experts suggest a slowdown in dynamics from 5.4% to 5.2%.
Support and resistance
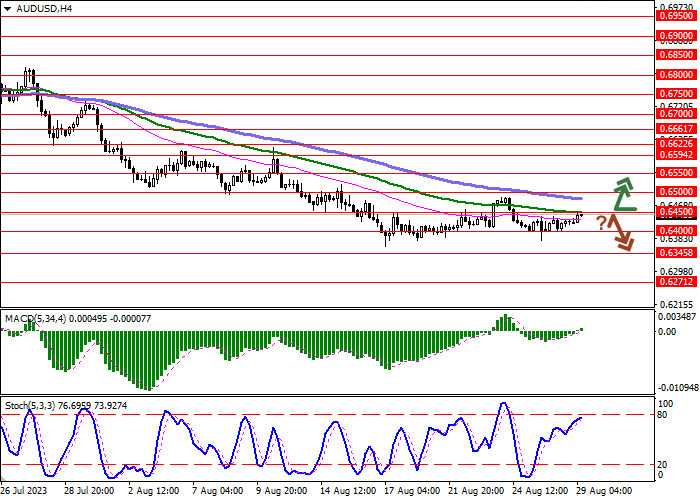
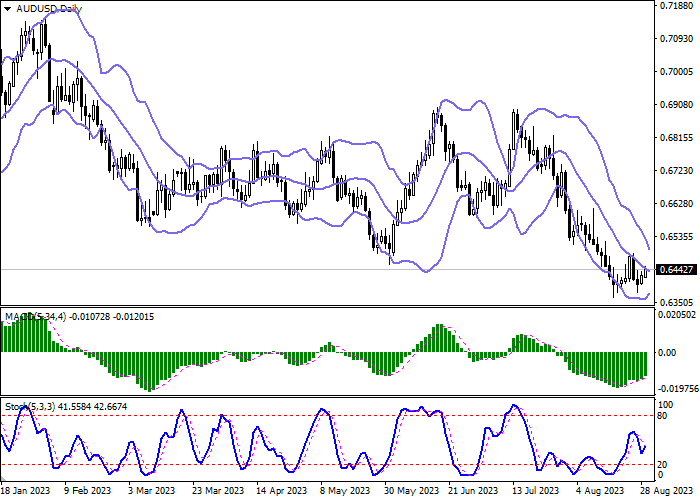
Bollinger Bands on the daily chart show a steady decline. The price range is narrowing, reflecting ambiguous dynamics of trading in the short term. MACD indicator is growing, while preserving a rather stable buy signal (located above the signal line). Stochastic reversed upwards again after a short decline last week. At the moment, the indicator is located approximately in the center of its area.
Resistance levels: 0.6450, 0.6500, 0.6550, 0.6594.
Support levels: 0.6400, 0.6345, 0.6271, 0.6200.
Trading tips
Long positions can be opened after a breakout of 0.6450 with the target of 0.6550. Stop-loss — 0.6400. Implementation time: 2-3 days.
A rebound from 0.6450 as from resistance, followed by a breakdown of 0.6400 may become a signal for opening of new short positions with the target at 0.6300. Stop-loss — 0.6450.
Tuyên bố miễn trừ trách nhiệm: Quan điểm được trình bày hoàn toàn là của tác giả và không đại diện cho quan điểm chính thức của Followme. Followme không chịu trách nhiệm về tính chính xác, đầy đủ hoặc độ tin cậy của thông tin được cung cấp và không chịu trách nhiệm cho bất kỳ hành động nào được thực hiện dựa trên nội dung, trừ khi được nêu rõ bằng văn bản.
 Chưa có bình luận nào. Hãy là người đầu tiên chia sẻ ý kiến của bạn.