


| Scenario | |
|---|---|
| Timeframe | Weekly |
| Recommendation | SELL STOP |
| Entry Point | 244.00 |
| Take Profit | 214.00 |
| Stop Loss | 255.00 |
| Key Levels | 244.00, 250.00, 253.00, 255.00, 258.00, 298.00 |
| Alternative scenario | |
|---|---|
| Recommendation | BUY STOP |
| Entry Point | 264.00 |
| Take Profit | 284.00 |
| Stop Loss | 258.00 |
| Key Levels | 244.00, 250.00, 253.00, 255.00, 258.00, 298.00 |
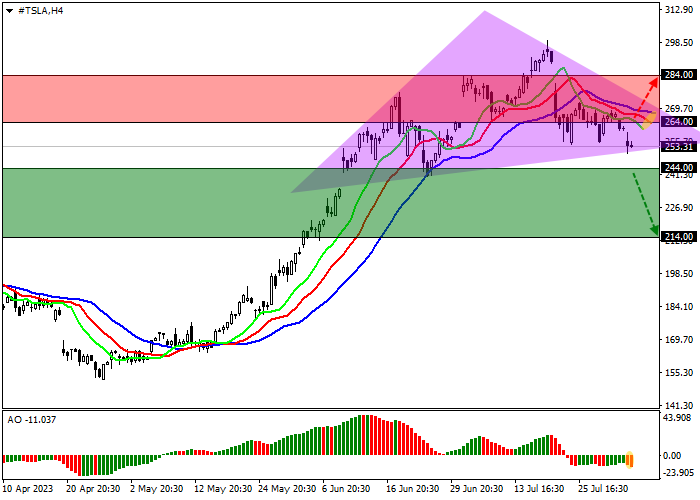
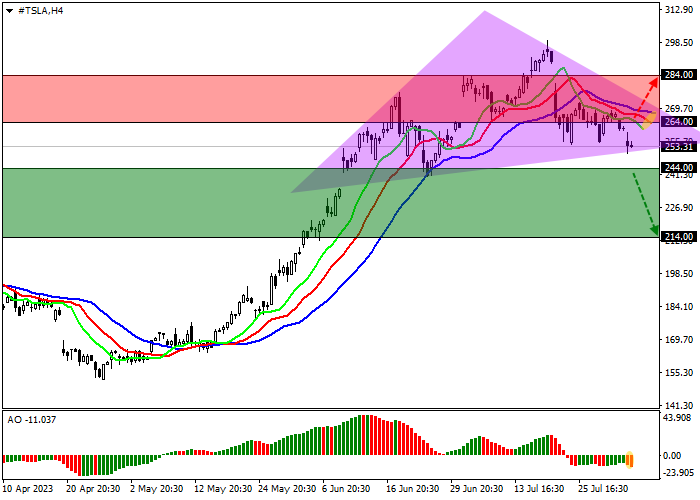
Shares of Tesla Inc., the world’s leading manufacturer of electric cars, are correcting at 253.00.
On the daily chart, the price is starting to decline from the year’s high of 298.00.
On the four-hour chart, a local reversal Head and shoulders pattern with the Neckline at 250.00 formed. A consolidation below the June 26 low at 244.00 will increase the negative momentum.
Technical indicators confirm the development of negative dynamics: fast EMAs on the Alligator indicator are moving away from the signal line, expanding the fluctuation range, and the AO histogram is forming downward bars in the sell zone.
Trading tips
Short positions may be opened after a reversal, reduction, and consolidation of the price below 244.00 with the target at 214.00. Stop loss – 255.00. Implementation period: 7 days or more.
Long positions may be opened after the price rises and consolidates above 264.00 with the target at 284.00. Stop loss – 258.00.
Tuyên bố miễn trừ trách nhiệm: Quan điểm được trình bày hoàn toàn là của tác giả và không đại diện cho quan điểm chính thức của Followme. Followme không chịu trách nhiệm về tính chính xác, đầy đủ hoặc độ tin cậy của thông tin được cung cấp và không chịu trách nhiệm cho bất kỳ hành động nào được thực hiện dựa trên nội dung, trừ khi được nêu rõ bằng văn bản.
 Chưa có bình luận nào. Hãy là người đầu tiên chia sẻ ý kiến của bạn.
