


| Scenario | |
|---|---|
| Timeframe | Intraday |
| Recommendation | SELL |
| Entry Point | 0.8600 |
| Take Profit | 0.8464 |
| Stop Loss | 0.8635 |
| Key Levels | 0.8464, 0.8587, 0.8622, 0.8635 |
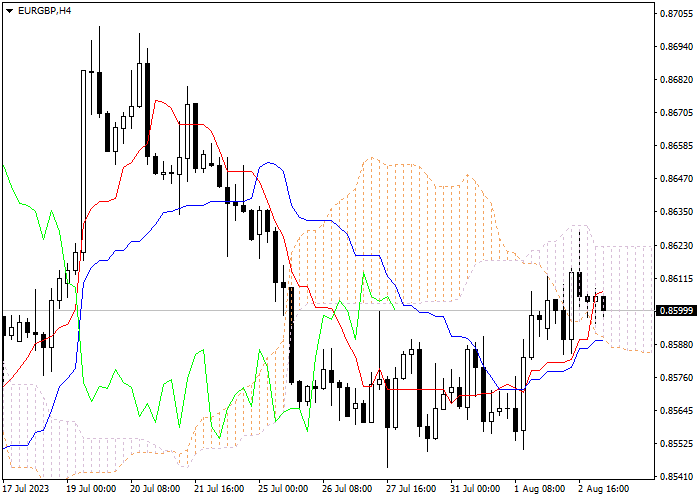
Let's look at the four-hour chart. Tenkan-sen line is above Kijun-sen, the blue line is directed upwards, while the red one remains horizontal. Confirmative line Chikou Span is above the price chart, current cloud is descending. The instrument has entered the cloud. The closest support level is the lower border of the cloud (0.8587). The closest resistance level is the lower border of the cloud (0.8622).
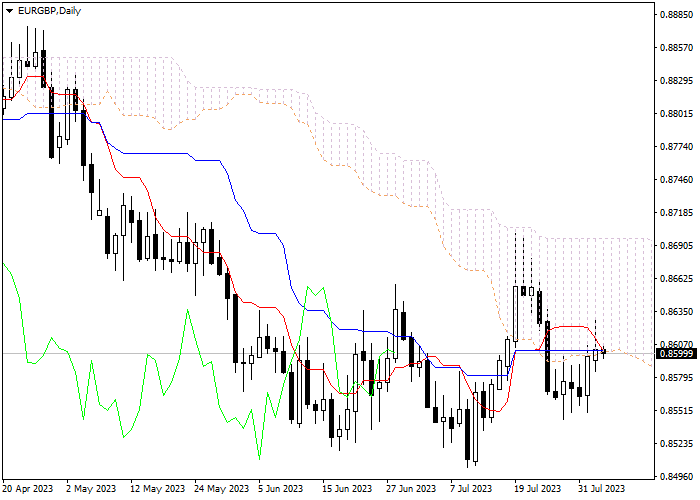
On the daily chart Tenkan-sen and Kijun-sen lines have merged, the lines are horizontal . Confirmative line Chikou Span is crossing the price chart from above, current cloud has reversed from descending to ascending. The instrument is trading around lower border of the cloud. The closest support level is the lower border of the cloud (0.8635). One of the previous maximums of Chikou Span line is expected to be a resistance level (0.8464).
On the four-hour chart the instrument is trading within the cloud. On the daily chart the Bearish trend is still strong. It is recommended to open short positions at current price with the target at the level of previous minimum of Chikou Span line (0.8464) and Stop Loss at the lower border of the cloud (0.8635).
Tuyên bố miễn trừ trách nhiệm: Quan điểm được trình bày hoàn toàn là của tác giả và không đại diện cho quan điểm chính thức của Followme. Followme không chịu trách nhiệm về tính chính xác, đầy đủ hoặc độ tin cậy của thông tin được cung cấp và không chịu trách nhiệm cho bất kỳ hành động nào được thực hiện dựa trên nội dung, trừ khi được nêu rõ bằng văn bản.
 Chưa có bình luận nào. Hãy là người đầu tiên chia sẻ ý kiến của bạn.