


| Scenario | |
|---|---|
| Timeframe | Weekly |
| Recommendation | BUY |
| Entry Point | 24.23 |
| Take Profit | 26.10, 28.80 |
| Stop Loss | 23.75 |
| Key Levels | 21.76, 23.00, 23.75, 26.10, 28.80 |
| Alternative scenario | |
|---|---|
| Recommendation | SELL STOP |
| Entry Point | 23.70 |
| Take Profit | 23.00, 21.76 |
| Stop Loss | 24.05 |
| Key Levels | 21.76, 23.00, 23.75, 26.10, 28.80 |
Growth is possible.
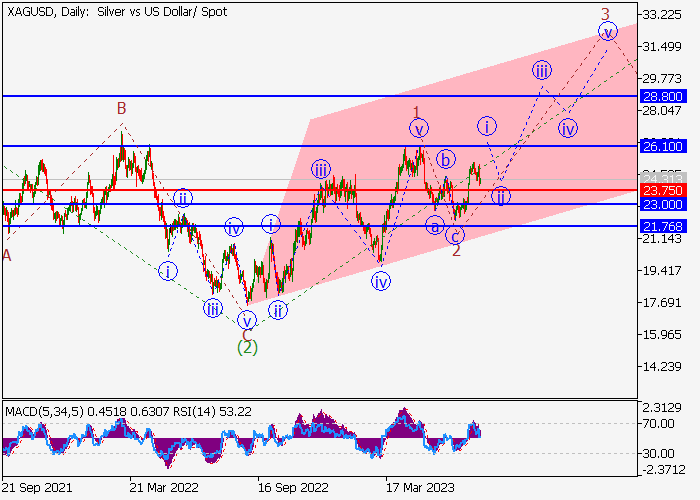
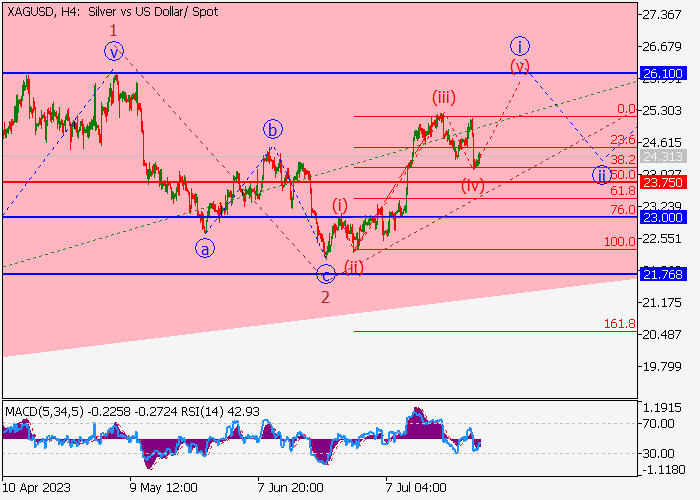
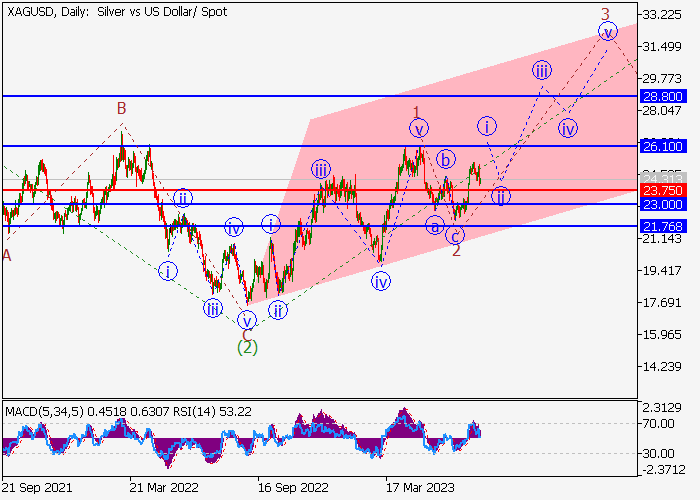
On the daily chart, a downward correction of the higher level ended as the second wave (2), and the third wave (3) develops, within which the entry first wave of the lower level 1 of (3) formed. Now, a local correction has ended as the second wave 2 of (3), and the development of the third wave 3 of (3) has started, within which the wave i of 3 is forming. If the assumption is correct, the XAG/USD pair will grow to the area of 26.10–28.80. In this scenario, critical stop loss level is 23.75.
Main scenario
Long positions will become relevant above the level of 23.75 with the targets at 26.10–28.80. Implementation period: 7 days and more.
Alternative scenario
A breakout and the consolidation of the price below the level of 23.75 will let the asset go down to the area of 23.00–21.76.
Tuyên bố miễn trừ trách nhiệm: Quan điểm được trình bày hoàn toàn là của tác giả và không đại diện cho quan điểm chính thức của Followme. Followme không chịu trách nhiệm về tính chính xác, đầy đủ hoặc độ tin cậy của thông tin được cung cấp và không chịu trách nhiệm cho bất kỳ hành động nào được thực hiện dựa trên nội dung, trừ khi được nêu rõ bằng văn bản.
 Chưa có bình luận nào. Hãy là người đầu tiên chia sẻ ý kiến của bạn.